
Europe monthly temperatures: Weather Averages for European Cities
July Temperature Averages in European Cities
Average temperatures for July at major cities throughout Europe are listed below in degrees Celsius and Fahrenheit.
The cities range from Amsterdam to Zurich and from Reykjavík to İstanbul. They are listed alphabetically and you can jump ahead to the section for Amsterdam to Kiev, Leeds to Pristina and Reykjavík to Zurich.
Included in this list are Europe’s national capitals plus cities with a metropolitan population of over one million people.
The tables give the normal maximum and minimum monthly temperatures based on historical weather data collected over a long period, in most cases 30 years.
| High °F | Low °F | City | High °C | Low °C |
|---|---|---|---|---|
| 72 | 55 | Amsterdam, Netherlands | 22 | 13 |
| 78 | 58 | Andorra la Vella, Andorra | 26 | 15 |
| 89 | 73 | Athens, Greece | 32 | 23 |
| 82 | 65 | Barcelona, Spain | 28 | 19 |
| 83 | 64 | Belgrade, Serbia | 29 | 18 |
| 75 | 58 | Berlin, Germany | 24 | 14 |
| 71 | 53 | Birmingham, United Kingdom | 22 | 12 |
| 80 | 58 | Bratislava, Slovakia | 27 | 15 |
| 73 | 57 | Brussels, Belgium | 23 | 14 |
| 84 | 60 | Bucharest, Romania | 29 | 16 |
| 81 | 62 | Budapest, Hungary | 27 | 16 |
| 79 | 61 | Chisinau, Moldova | 26 | 16 |
| 75 | 55 | Cologne, Germany | 24 | 13 |
| 70 | 55 | Copenhagen, Denmark | 21 | 13 |
| 67 | 53 | Dublin, Ireland | 20 | 12 |
| 67 | 52 | Glasgow, United Kingdom | 19 | 11 |
| 72 | 55 | Hamburg, Germany | 22 | 13 |
| 73 | 55 | Helsinki, Finland | 23 | 13 |
| 85 | 69 | İstanbul, Turkey | 29 | 20 |
| 77 | 59 | Kazan, Russia | 25 | 15 |
| 76 | 59 | Kiev, Ukraine | 25 | 15 |
| High °F | Low °F | City | High °C | Low °C |
|---|---|---|---|---|
| 66 | 52 | Leeds, United Kingdom | 19 | 11 |
| 74 | 57 | Lille, France | 23 | 14 |
| 82 | 64 | Lisbon, Portugal | 28 | 18 |
| 80 | 58 | Ljubljana, Slovenia | 27 | 15 |
| 74 | 57 | London, United Kingdom | 23 | 14 |
| 72 | 54 | Luxembourg, Luxembourg | 22 | 12 |
| 82 | 62 | Lyon, France | 28 | 17 |
| 88 | 65 | Madrid, Spain | 31 | 18 |
| 69 | 55 | Manchester, United Kingdom | 21 | 13 |
| 86 | 67 | Marseille, France | 30 | 19 |
| 85 | 64 | Milan, Italy | 29 | 18 |
| 72 | 55 | Minsk, Belarus | 22 | 13 |
| 81 | 69 | Monaco, Monaco | 27 | 20 |
| 74 | 56 | Moscow, Russia | 23 | 14 |
| 74 | 55 | Munich, Germany | 23 | 13 |
| 86 | 66 | Naples, Italy | 30 | 19 |
| 81 | 69 | Nice, France | 27 | 20 |
| 74 | 58 | Nizhny & Novgorod, Russia | 24 | 14 |
| 71 | 54 | Oslo, Norway | 22 | 12 |
| 77 | 60 | Paris, France | 25 | 16 |
| 89 | 69 | Podgorica, Montenegro | 32 | 20 |
| 74 | 53 | Prague, Czech Republic | 23 | 12 |
| 80 | 55 | Pristina, Kosovo | 26 | 13 |
| High °F | Low °F | City | High °C | Low °C |
|---|---|---|---|---|
| 56 | 47 | Reykjavík, Iceland | 13 | 8 |
| 71 | 54 | Riga, Latvia | 22 | 12 |
| 89 | 62 | Rome, Italy | 32 | 17 |
| 85 | 64 | Rostov-on-Don, Russia | 29 | 18 |
| 72 | 56 | Rotterdam, Netherlands | 22 | 13 |
| 71 | 57 | Saint Petersburg, Russia | 22 | 14 |
| 79 | 61 | Samara, Russia | 26 | 16 |
| 83 | 64 | San Marino, San Marino | 29 | 18 |
| 78 | 55 | Sarajevo, Bosnia & Herzegovina | 26 | 13 |
| 86 | 61 | Skopje, Macedonia | 30 | 16 |
| 79 | 57 | Sofia, Bulgaria | 26 | 14 |
| 71 | 56 | Stockholm, Sweden | 22 | 13 |
| 70 | 54 | Tallinn, Estonia | 21 | 12 |
| 89 | 61 | Tirana, Albania | 32 | 16 |
| 82 | 62 | Turin, Italy | 28 | 17 |
| 78 | 56 | Ufa, Russia | 26 | 14 |
| 76 | 57 | Vaduz, Liechtenstein | 25 | 14 |
| 87 | 70 | Valletta, Malta | 31 | 21 |
| 80 | 61 | Vienna, Austria | 27 | 16 |
| 72 | 54 | Vilnius, Lithuania | 22 | 12 |
| 85 | 65 | Volgograd, Russia | 29 | 18 |
| 74 | 55 | Warsaw, Poland | 23 | 13 |
| 80 | 58 | Zagreb, Croatia | 27 | 15 |
| 77 | 55 | Zurich, Switzerland | 25 | 13 |
Europe continued to swelter in July
Following two months of intense heat in May and June, Europe continued to swelter in July with an intense and prolonged heatwave that started in Spain and Portugal before spreading further north and east, towards France, the United Kingdom, central Europe and Scandinavia. Dry conditions also continued throughout last month, exacerbated by the heat. As a result, some countries saw record high temperatures and recorded their driest July ever. The Copernicus Climate Change Service (C3S*) has been monitoring the situation.
Around mid-July, an area of high pressure settled over western Europe, bringing clear-sky, dry conditions and high insolation. This, combined with hot air flow from North Africa ahead of a trough moving north-eastwards from west of Portugal, led to heatwave conditions which affected most of western Europe.
Temperatures soared to above 40°C for at least one day in Spain, France and the United Kingdom. In particular, the UK saw a national daily maximum temperature record of 40.3°C, set at Coningsby in Lincolnshire on July 19 – the first time that the country ever recorded a temperature of over 40°C. In general, the data indicates that the previous UK temperature record of 38.7°C (recorded in July 2019) was met or exceeded at 46 stations across the country.
ERA5, ECMWF’s fifth generation atmospheric reanalysis of the global climate covering the period from January 1950 to the present, allows us to calculate the average number of July days where temperatures of over 40°C were recorded in the 1991-2020 reference period. Analyses carried out using ERA5 show no temperatures above this threshold for the UK in this reference period. However, for France and the Iberian Peninsula, July 2022 was not a record month in terms of the number of days with temperatures over 40°C.
Longevity v extremes
Western Europe in general saw a larger number of days with temperatures above 30°C, 35°C and 40°C than a typical July. While the heatwave was very intense in terms of daily temperature extremes in some regions of western Europe, reaching local and national records (as we have seen above), it was mainly the longevity of the period with daily maximum temperatures between 35°C and 40°C that characterised July, rather than the very extreme temperatures of above 40°C, particularly in southwestern Europe. The number of days above 30°C was also well above average but, as for the number of days above 35°C, generally not record-breaking. The low number of days above 35°C in southeastern Europe is also noteworthy, again indicating that the heat mainly affected the southwest.
As indicated in the animation below, throughout the month conditions alternated between above and below average temperatures over most of Europe. The very large positive anomalies that coincide with the heatwave sweeping over the west of Europe in the middle of the month are clearly visible.
ERA5 daily mean temperature anomalies over Europe in July relative to the daily average for the period 1991-2020 , with red showing warmer than average and blue colder than average conditions. Source: C3S/ECMWF. DOWNLOAD VIDEO
Final figures show that July was the warmest on record in southwestern Europe in terms of average maximum temperatures. Average minimum temperatures were also among the top three.1
Monthly average temperature anomalies for south-west Europe in May-July 2022. Source: C3S/ECMWF. DOWNLOAD IMAGE
Looking at average daily temperatures (below) for the region and comparing them to the heatwaves in May and June, we see that temperatures reached record-highs for several days in July, whereas during the previous months it was only at the peak of the heatwaves that record maximum regional temperatures were recorded.
The run of record average temperatures in southwestern Europe in July bears comparison with the extended spell of high temperatures in August 2003 and the brief period of very high temperatures in August 2021.
Average daily maximum and minimum temperatures (March-August) over south-west Europe. Source: C3S/ECMWF. DOWNLOAD IMAGE
It is still too early to say if this will be a record summer both for Europe and its sub-regions in terms of average temperature (figures for August are needed to reach a final conclusion). However, unless temperatures in August are more than 0.45°C below average, which has only happened once during the 21th century, this summer will be one of the five hottest on record.
Widespread dry conditions
Europe experienced dry conditions during most of July, with much of the continent seeing rainfall and, in particular, soil moisture well below average (see below). The month began with conditions already dry, following a drier-than-average June over the UK, Ireland, Italy and most of the Iberian Peninsula, in addition to a large region stretching from the northern Balkans across eastern Europe and to north-western Russia.
Monthly soil moisture anomaly (%) for July. The anomalies are expressed as a percentage of the July average for the 1991–2020 reference period. Source: ERA5/C3S. DOWNLOAD IMAGE
Southern England experienced its driest July since records began in 1836. The UK as a whole saw just 56% (46.3mm) of its average rainfall for July, making it the driest July in over 20 years. This continued a run of months, with the exception of February, that were drier than average in 2022 so far.
A similar situation was observed in France, where July was the second driest month since records began. With a total rainfall of 9.7 millimetres, last month was the driest July since records began in 1959, according to the French meteorological and climate service. This represents a rainfall deficit of 85% compared to the average for the 1991-2020 reference period. The previous records dated back to July 2020 with 16.7 millimetres of precipitation, and July 1964 with 24.7 millimetres.
Persistent lack of precipitation since December 2021 has had a major impact in northern Italy, where the Po River completely disappeared in places. In late June, the flow measured at Pontelagoscuro, near Ferrara, fell below an average of 145 cubic metres per second (the historic average flow for June is 1,805 cubic metres per second). In mid-July at Cremona – roughly halfway along the Po – the water was more than 8 metres below “hydrographic zero”. These dry conditions adversely affected energy production, agriculture and river transport in the region.
The situation in the Po Valley later improved thanks to precipitation towards the end of the month, resulting in a water level increase of 40 centimetres for the river, although hydropower production in the region was still affected, as the Enel Green Power hydroelectric plant in Isola Serafini (Monticelli d’Ongina, Piacenza) remained offline.
Far-reaching adverse societal and environmental impacts
Reduced hydropower output was only one of the impacts of the high temperatures and dry conditions. July’s hot and dry conditions resulted in a wide range of adverse impacts, some of which were forecast and monitored by Copernicus services.
For example, heatwaves and exposure to extreme temperatures can have serious adverse health impacts and cause heat exhaustion and heat stroke. Moreover, high temperatures cause high levels of surface ozone, which can also have a significant impact on human health, ranging from headaches, asthma attacks and other respiratory problems to cardio-vascular illnesses. The Copernicus Atmosphere Monitoring Service (CAMS*) forecast very high levels of surface ozone pollution across a large region of Europe as temperatures soared in July.
The Copernicus Emergency Management Service (CEMS) repeatedly warned of increased fire danger due to the lack of rain and the resulting dry vegetation, combined with high temperatures. Wildfire activity in July resulted in many records being broken, in terms of the intensity and damage caused by the fires, but also in terms of the number of СEMS Rapid Mapping activations. CAMS is also monitoring fire activity in Europe, following its first report on wildfire activity in Europe and other parts of the northern hemisphere at the start of the boreal forest fire season.
Locations and fire radiative power (FRP) of active fires in southwest Europe in July 2022. Source: CAMS/ECMWF
In agriculture, the effects of the hot and dry conditions have been severely felt. In France, due to the 85% rainfall deficit mentioned above, 90 of the country’s 96 départements had been placed on drought alert to varying degrees by July 27, with 87 départements placing restrictions on irrigation for agriculture. These restrictions, and the hot dry conditions that caused them, had inevitable consequences in terms of agricultural output in France and elsewhere.
The Joint Research Centre (JRC), the European Commission’s in-house science service, issued a yield outlook for EU summer crops that was substantially reduced due to continued hot and dry conditions in large parts of Europe. At EU level, the yield forecasts for grain maize, sunflowers and soybeans were most markedly reduced (by 8 to 9%) and are now well below the 5-year average.
Climate data at your fingertips
C3S produces monthly climate bulletins with data on surface air temperature, sea ice and hydrological variables, which are published on its website. In addition, it provides monthly, seasonal, and yearly updates largely based on the ERA5 reanalysis dataset and makes this data freely available in the C3S Climate Data Store (CDS).
The July issue of the C3S Climate Bulletin reports that, globally, July 2022 was 0.38°C warmer than the 1991-2020 average for July and one of the three warmest Julys on record. The European-average temperature for July was 0.72°C above the 1991-2020 average, making it the joint sixth warmest July, with July 2006, in this data record. July 2022 was 1.0°C colder than the warmest July, which occurred in 2010.
As regards hydrology, the July Bulletin notes that July 2022 was drier than average for most of western Europe. Precipitation, soil moisture and relative humidity were all consistently below average from the Iberian Peninsula across the continent to the Black Sea, including the UK and Ireland and southern Scandinavia, and parts of western Russia and the Caucasus. France and parts of the UK experienced the driest July based on local precipitation records. Conversely, it was wetter than average over much of Scandinavia, Iceland and in regions of central and eastern Europe. Despite average precipitation, Türkiye experienced wetter soils, the legacy of June’s wetter-than-average conditions.
* C3S and CAMS are implemented by the European Centre for Medium-Range Weather Forecasts on behalf of the European Commission
- 1.
-
The South-West Europe region used to calculate the anomaly timeseries is defined as land bounded by longitudes 25°W and 15°E and latitudes 36°N and 45°N, excluding the region bounded by longitudes 0 to 12E and latitudes 36 to 38N”.


Back to top
A new Weather pattern is developing over Northern Hemisphere, creating a weaker and more disrupted circulation as we head closer to Autumn
A weather pattern change is starting over the Northern Hemisphere, just in time for the final stage of the meteorological Summer. But as the pressure-systems shift, we will see a temperature drop over much of the United States, a heatwave over the Pacific Northwest, and a longwave moving over Europe.
First, we will quickly look at the Summer so far. But then, we will focus mainly on the changing pressure patterns over the Northern Hemisphere and how they will shape our weather as we step closer to the beginning of the meteorological Fall season.
HALFWAY THROUGH SUMMER
Meteorological Summer covers the 3-monthly period of June, July, and August. These are the warmest three months in the Nothern Hemisphere and represent the summer season in the statistics.
We are already past two-thirds of Summer, so we can look back at how the weather patterns have evolved so far.
The pressure pattern behind June and July has featured high-pressure zones over much of the United States and Europe. In addition, we can see a deep low-pressure system over Greenland and a high-pressure area expanding from Aleutians to northern Canada.
Below we have the temperature anomaly analysis for the same period. We can see that Summer so far has been warmer than normal in Europe and most of the United States, and northern Canada. Colder than average temperatures were present over Greenland and parts of eastern Canada.
Precipitation-wise, we see drier conditions in the southern United States, the midwest, and parts of western and northern Canada. But there was more rainfall in the southwestern United States, the Pacific Northwest, and over the Ohio river valley.
Over Europe, we see mostly drier conditions. The exceptions are certain regions with more convective activity/storms in western and central parts. Scandinavia has mostly seen more precipitation than usual.
But what was driving the Summer weather thus far, and how will it shape the rest of the season?
WEATHER DRIVERS
La Nina is one of the main factors behind the weather patterns this Summer. We can see it as an area of cold ocean anomalies in the tropical Pacific Ocean. The ocean temperature analysis by NOAA below nicely reveals the active La Nina phase.
But while the La Nina has a low-frequency background influence, many shorter-period atmospheric waves circulate the tropics.
ATMOSPHERIC WAVES
A lot of the global variability is driven by invisible tropical “waves” in the atmosphere. The largest and most dominant source of short-term variability from the tropical regions is the Madden-Julian Oscillation wave (MJO).
MJO is an eastward-moving disturbance of thunderstorms, clouds, rain, winds, and pressure anomalies. It moves across the Earth on the equator in about 30 to 60 days.
It also has the power to influence the weather patterns further north over the North Hemisphere, as there is a strong connection between the tropics and the global weather.
The MJO consists of two parts: one is the enhanced rainfall (wet) phase, and the other is the suppressed rainfall (dry) phase. Image by NOAA Climate.
The MJO wave was an important part of the Summer weather patterns so far, as it was active over June and July. The image below shows a strong, active phase of MJO in July, with upward motion over the western Pacific and suppressed activity over the Americas.
We have also produced a video animation showing the global precipitable water. You can see how the tropical regions connect with the mid-latitudes, creating “atmospheric rivers” and connecting to the global weather system.
Below is an ECMWF ensemble forecast of the MJO activity. It is quite easy to read, as we can see in which phases the wave is moving and on which day. If the wave is within the central circle, it is considered weak.
You can see past activity with the black lines. But the forecast shows little activity in the short-term forecast. This means that most of August will go by without a strong MJO influence.
But what will the rest of the Summer look like, and what does the forecast show for the start of the meteorological Fall season?
A PATTERN CHANGE
With the MJO out of the equation, for now, we can observe the North Hemisphere circulation by looking at the Arctic Oscillation (AO).
The Arctic Oscillation index explains the pressure pattern and circulation over the North Pole. A positive phase means a stronger and more stable lower level polar circulation, while a negative phase means high pressure over the polar regions and a disrupted flow.
This is much more profound during the Winter when the pressure patterns are stronger, and the Polar Vortex is active. A positive or negative phase of the AO can open or close “the gates of the Arctic”, releasing cold air into the United States and Europe.
The positive phase means stable circulation and contains cold air. Negative AO means the circulation is weak, and the jet stream is wavy, so cold air can escape the polar regions during the Winter.
While there are no cold air outbreaks during the Summer, the Arctic Oscillation is still used to indicate the weather pattern development and overall circulation. As seen in the forecast below, we can see that we are in a positive AO phase now, but the forecast calls for a negative phase.
We can see on the atmospheric pressure anomaly map below how the pattern will change. Currently, we have the positive mode (blue square), but high latitude blocking (red square) is set to appear by mid-month, creating a more disrupted hemispheric flow. Image by StratObserve.
Looking at the pressure anomaly forecast for this week, you can see the low-pressure zone over the polar regions. That is the positive AO mode, of course, more confined to the arctic circle in Summer. Around it, we have a strong high-pressure zone over northern Europe, creating a rex-block pattern.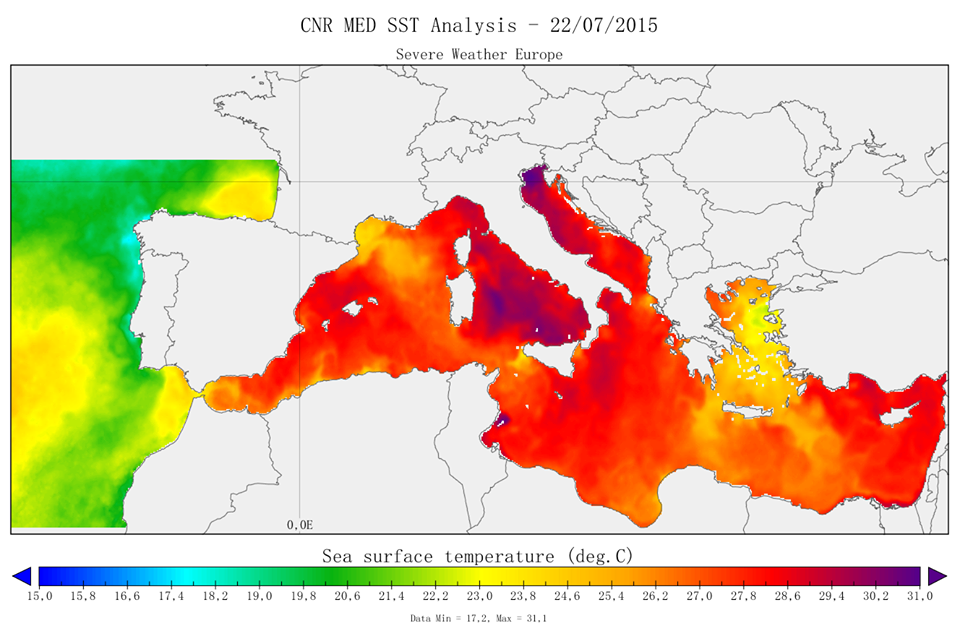
Over North America, we can see a strong ridge over the western United States, expanding further north into Canada. In response, we have a low-pressure area (trough) standing over the eastern United States.
Looking at the 850mb temperature anomalies, we can first see a cold anomaly in the Arctic, thanks to the strong low-pressure system. Then, the strong warm anomalies enter western and northern Europe under the high-pressure zone.
An interesting temperature pattern has started to develop in the United States. Cooler air starts to come down into the eastern parts of the country under the low-pressure area. Warm anomalies are building in the northwestern United States and western Canada.
The surface temperature forecast across the United States shows cooler than normal morning temperatures over much of the eastern and southern United States. In Winter, such a pattern could create a decent cold air outbreak.
Precipitation-wise over North America, we can see more rainfall over the Midwest and the western United States. Over the southern United States, we mainly see drier conditions over the weekend and early next week.
WEATHER IN LATE AUGUST
Next week, the pressure pattern will change over the polar regions. This reflects the change in the Arctic Oscillation phase from positive to negative. You can see the high-pressure building into the polar region, replacing the prior low-pressure area.
Two strong ridges connect across the polar circle. One over the Arctic Ocean and the strengthening ridge over the western United States and Canada. A low-pressure zone amplifies over the eastern United States and western Europe.
Looking at the temperature anomalies, we can first see a cold anomaly extending across the United States as the low-pressure zone regresses westward. Strong heat domes build over the northwestern United States and Canada and over northern and southern Europe.
Over North America, we can see a strong contrast between western Canada and the United States. With the exception of the far northwest, we can see colder than normal daily temperatures over most of the United States.
Higher than normal temperatures are expected to develop under the ridge covering the northwestern United States and Canada. Temperatures over 37 degrees celsius (100F) are expected over the Northwestern United States and over 32 degrees celsius (90F) over southwestern Canada.
We are also in an ongoing Hurricane season. But looking at the development in the Tropics, we can see no real activity in the near future. The ECMWF ensemble forecast shows no tropical storm formation in the next 10 days.
6-10 DAY OFFICIAL WEATHER OUTLOOK
NOAA regularly releases its weekly forecasts for the United States. Below is the temperature forecast in the 6-10 day range, which covers mid-August. You can see the higher temperatures in the northwestern United States and a cooler than normal Summer over much of the central and eastern part of the country.
We also have the official precipitation outlook below, which calls for more precipitation over much of the United States, except for the Midwest and the north.
LATE-MONTH WEATHER PATTERN
In this period, the ECMWF pressure forecast shows a high-pressure area stabilizing over the polar circle and Canada. This is a typical disruption of circulation, with low-pressure zones circling the Aleutians, the United States, and northwestern Europe.
The 850mb temperature anomaly for late-month shows warm anomalies returning over central and western Europe. The heatwave continues over the Pacific Northwest while a cold anomaly drops further back into the central United States.
Below we have a surface temperature anomaly forecast over North America. The forecast calls for colder than normal air spreading into parts of the Midwest and reaching down towards the southern United States. Hotter conditions still prevail over the northwestern United States and southwestern Canada.
NOAA 8-14 DAY WEATHER OUTLOOK
This is also reflected in the official NOAA 8-14 day temperature outlook. NOAA is forecasting cooler than normal conditions over much of the central United States. Warmer weather is forecast to continue over the western United States, with temperatures rising again in the northeast.
NOAA precipitation outlook also calls for wetter conditions over the southern and eastern United States. The northern part of the country is forecast to receive less precipitation than normal under the influence of the ridge.
EXTENDED RANGE WEATHER
Looking further into the end of August and early September, we will use the ECMWF extended ensemble forecast.
The pressure pattern forecast for the month transition shows a high-pressure area remaining over Canada, also covering the western United States. That hints at possible lower pressure over the eastern United States. In addition, a high-pressure zone extends over northern Europe.
The temperature forecast for Europe shows warm anomalies over much of central and western Europe. But there is no strong warm signal, for now, that would hint at unusually warm/hot weather for the end of the month.
The temperature forecast for North America shows cooler than normal temperatures in the southern half of the United States. Warmer than normal weather is expected to continue over the northwestern United States and southwest Canada under high pressure.
Precipitation-wise, more rainfall is expected in the south-central United States, along with the active monsoon in the southwest. Drier conditions prevail over the northern United States and southern Canada.
Looking at the tropical development in this range, we have a low probability of tropical storm development. Some indication is shown along the east coast of the United States, but the probability remains very low at the moment.
FROM SUMMER TO AUTUMN
September marks the first month of the meteorological Fall. The meteorological season covers 3 months, September, October, and November. So, the transition from August to September marks the shift from meteorological Summer to Fall.
The extended forecast trend for early Sept shows continued high pressure over western Canada and a likely low-pressure response in the southern United States. This would promote a continued northerly flow into the southern United States.
Over Europe, we see the high-pressure zone easing away from northern Europe back into the North Atlantic. This could indicate a more unstable pattern over the continent.
Looking at the temperature forecast for Europe in this period, the warm anomalies over the central parts are almost gone. This confirms a more unstable pattern is likely over the continent, with a shift towards a more Autumn configuration.
Looking at the temperature forecast for North America, we see the warm anomalies remaining over the northwestern and northeastern United States. However, a cooler than normal area remains over the southern part of the country, linked to a likely low-pressure area.
The precipitation forecast shows more precipitation trending in the southern and western parts of the country. Drier conditions prevail in the Pacific Northwest of the United States and southwestern Canada.
In the early parts of September, we still see little in the way of any significant development. Some signals are from the east coast up into the northeast, but that is likely not a real or pure tropical low-pressure development.
But as we move into the Fall, what do the latest seasonal trends show for the upcoming weather season?
AUTUMN SEASON 2022 OUTLOOK
Below we have an analysis/forecast graphic by ECMWF, which shows the long-range forecast of the main ENSO region. The La Nina conditions remain over the Fall and Winter seasons. But a weakening of the La Nina is expected for early next year, with an El Nino hint for later in the year.
Another respected ENSO forecast comes from the Australian BOM office. They produced a graph that contains multiple forecasts from different global models. They all agree on a continued negative ENSO phase from Fall into Winter.
There are differences in the strength of the La Nina at this period, but the average forecast from all models agrees on an active moderate event.
A more direct ENSO influence can be found in North America. For this reason, we produced a graphic that combines 10 of the last La Nina Fall seasons, showing the average weather pattern during a La Nina Fall season.
On the pressure anomaly pattern, you can see three areas of high-pressure anomalies and a low-pressure zone over Alaska and western Canada.
High-pressure anomaly in the North Pacific is more of a classical La Nina signature in all seasons. But in autumn, the high-pressure area over the western United States is also often seen. There is also a high-pressure anomaly in the North Atlantic.
ECMWF FALL 2022 FORECAST
The pressure anomaly forecast shows the typical La Nina high-pressure system in the North Pacific, with another high over the western United States and the North Atlantic. This is a similar pattern to the historical analysis we have done above. It also has a low-pressure zone hinted over Alaska and western Canada.
Looking at the European sector, we have a high-pressure zone extending from the North Atlantic over Europe. As a response, the low-pressure zone is moved further up to the north.
When we look at the global air temperature anomaly distribution, we can see the warmer anomalies over the western United States and Europe. Northwestern Canada and Alaska are in a neutral zone, which will likely turn cooler in the next updates.
As seen in the historical analysis, you can also see weaker warm anomalies over the southeastern United States. Overall, this seems to be quite a typical La Nina Fall pattern, confirming its influence on global circulation.
Over Europe, we can see warmer than normal surface temperatures over much of the continent. This is due to a high-pressure area over the North Atlantic and extending into the continent.
Over North America, we see much warmer temperatures under a high-pressure system in the western United States. Warm anomalies extend into the northeastern United States and eastern Canada. But Alaska and northwestern Canada remain neutral to cool under the influence of the polar jet stream.
Precipitation-wise, we can see mostly drier conditions over Europe. More precipitation is forecast over northern Europe, under the influence of a low-pressure zone.
Over North America, we have wetter conditions over the northwestern United States, also expanding over western Canada. The Midwest and the southern United States show a dry signal, while we also see more precipitation over the southeast.
The La Nina influence is expected to grow later in the season, which means a low-pressure area will be further established over western Canada. This could mean early snowfall is likely for parts of the northwest and the northern United States.
Below is the official Fall 2022 outlook from NOAA/CPC for the United States. Temperature-wise, we see the warm west and far northeast standing out, as also seen in the ECMWF forecast.
We can also see a neutral temperature zone in the Midwest. That does indicate a chance of more cold fronts coming down from the northwestern United States and western Canada towards the central regions. It could mean earlier snowfall than normal in the northern United States.
Precipitation-wise, the NOAA Fall 2022 outlook shows drier conditions in the western and central United States. Wetter conditions are expected mostly on the east coast of the United States.
The typical issue with a La Nina is typically the support of drought conditions in the southern and western United States. Below we have the latest drought analysis from NOAA, which shows the current drought conditions across the United States.
Most of the western half of the United States is already under some drought conditions. The driest conditions prevail in the southern United States. Over the southwest, the monsoon has alleviated some of the drought conditions. However, some drought conditions are also seen in the northeast corner.
We will release regular weekly and monthly updates as fresh forecasts and data are available. So make sure to bookmark our page. Also, if you have seen this article in the Google App (Discover) feed, click the like button (♥) there to see more of our forecasts and our latest articles on weather and nature in general.
LEARN MORE:
An unusual ocean anomaly is growing in the North Pacific. How did it form, and what does it indicate for the weather seasons ahead?
Record June temperatures in western Europe – World Weather Attribution
June 2017 was marked by high temperatures across Western Europe, with heatwaves triggering national heat-health plans and wildfires requiring evacuations in Portugal and Spain.
Key findings
- Record-breaking heat gripped most of Western Europe during June 2017, sending monthly mean temperatures about 3 degrees Celsius (4. 8 degrees Fahrenheit) above normal (1981-2010).
- Scientists with World Weather Attribution (WWA) and partners in England, France and Switzerland conducted a multi-method analysis to assess whether and to what extent human-caused climate change played a role in the heat.
- These high temperatures are no longer rare in the current climate, occurring roughly every 10 to 30 years depending on the country.
- The team found that climate change made the intensity and frequency of such extreme heat at least twice as likely in Belgium, at least four times as likely in France, Switzerland, the Netherlands, and central England and at least 10 times as likely in Portugal and Spain.
 8 degrees Fahrenheit) above normal (1981-2010).
Introduction
Heatwaves can have significant impacts on human health and wellbeing including exacerbating existing medical conditions, particularly in the elderly and very young, and increasing energy demand, which can lead to disruptive power outages. In France, the night of June 21 will go down as the hottest June night ever recorded for most of the country as the average nighttime temperature reached 26. 4 degrees Celsius (79.52 degrees Fahrenheit). The average monthly June temperature in France was the second warmest on record after June 2003 in the official “heat index” series. Level three of France’s four-level heatwave plan, put in place after the devastating 2003 heat wave, was triggered for Paris as temperatures in the French capital topped 37 degrees Celsius (96.8 degrees Fahrenheit) during the week of June 19. In the Netherlands, June 2017 is likely to be the hottest June ever observed while in Switzerland, June 2017 is the second warmest since 1864 when observationsbegan. In northern areas, the minimum nighttime temperatures reached record highs of 24-25 degrees Celsius (75.2-77 degrees Fahrenheit). A level 3 warning was activated from June 20-23. In Britain the UK Met Office reported that Wednesday, June 21 was the hottest June day in more than 40 years when temperatures reached 34.5 degrees Celsius at Heathrow.
A major forest fire in Spain forced more than 1,500 people from homes, campsites, and hotels, and encroached on a UNESCO World Heritage site housing endangered species. In Portugal, a deadly forest fire killed at least 64 people, injured 204, and displaced over 500 from their homes. Triggering the EU’s Civil Protection Mechanism, France, Italy and Spain have provided firefighting planes to help get Portugal’s “worst forest fire in more than a century” under control. The smoke of the wildfires in Portugal were catapulted high into the atmosphere and then transported several thousands of kilometers across Europe. Smoke from the fires could be seen all the way to the Swiss Alps from the station at Jungfraujoch (3580 m).
The World Weather Attribution team in partnership with experts from other European countries conducted an event attribution study to investigate whether and to what extent human-induced climate change played a role in the high June temperatures across different countries in Western Europe.
Figure 1. Left: first estimate of Tmean anomalies for June 2017 relative to 1981-2010, right: rank of the anomalies (dark red is highest value, bright red second highest, usually after 2003). Source: ERA-interim/ECMWF analysis/ECMWF forecast via KNMI Climate Explorer.
Return periods & trends in observations
First we analyze the observed June temperature record in several Western European countries to assess whether or not there is a trend toward increasing temperature. We also compute the return periods of average monthly June temperature as observed in 2017 to assess how rare this heat event is. For two countries, Portugal and Spain, we additionally analyze the average maximum June temperatures as in these two countries not only minimum and mean temperatures but also the maxima were exceptional. The data are taken as the average of the 0.5º CRU TS 4.00 analysis 1901-2015 over all grid points within the boundaries of Portugal (without the Azores and Madeira), Spain (without the Canary Islands), France (without overseas territories but including Corsica) and Belgium. This was extended to June 25 using E-OBS v15.0 to Dec 2016, the monthly updates to May 2017 and the daily updates for 1–26 June 2017, with a bias correction to CRU TS computed from the overlap period 1950–2015. The data for June 27–30 were taken from the ECMWF analysis (27) and forecasts (28–30) with a bias correction to the daily E-OBS analysis starting 1979 using ERA-interim.
For Switzerland we used the Swissmean 1.0 series (1854–now) based on homogenized station data. The Netherlands were represented by the Central Netherlands Temperature v1.1 (1906–now). As this does not include the coastal areas, we restricted the model analyses to the box 51.5–52.5 ºN, 4.5–6.5 ºE. The same holds for England, where we used the Central England Temperature and the box 51–54 ºN, 0–3 ºW to represent the temperature series in models. As the variability of the CET is much larger before 1900 (King et al, 2015) we start our analyses in that year. All these series were extended to June 2017 using E-OBS for June 1–26 and ECMWF forecasts for June 27–30 as discussed above (for the CNT these are for the underlying stations rather than a box).
Based on these series we expect the mean temperature of June 2017 to be the highest one in the series in Portugal, Spain, France and the Central Netherlands. Note the Météo France “heat index” series based on 30 non-public stations gives a second place, after 2003. In Switzerland it is expected to be the second-highest since observations began in 1864, after 2003. Based on the CRU TS data, in Belgium it will be about the fifth warmest. The Central England June temperature will likely end up as the fourth highest June value since 1900.
We analyzed the observational data by fitting all June temperature observations to a distribution that shifts proportional to the smoothed global mean temperature. This method assumes that global warming is the main factor affecting local temperatures on the 100-yr time scale. This assumption is correct almost everywhere over land, which is dominated by the day-to-day variations of the weather. Natural variability with time scales of more than a century has a very small amplitude over land (Suckling 2016). It also assumes that climate change is linear, i.e., that all temperatures go up the same amount. This is not the case in areas where soil moisture depletion is important (Seneviratne 2010) and this assumption is checked in regional climate scenarios provided by the CORDEX initiative. For the distribution we take a Normal distribution, which fits the monthly mean data well. This reduces the fit to a simple linear regression. All fits exclude the year being studied, June 2017. The fits are shown in Figure 2 as a function of the global mean temperature with the linear fit, and as a function of the return period for the climates of 1901 (blue) and 2017 (red).
The probability in the climate of 1901 requires an extrapolation of several orders of magnitude in probability in the southern countries. This extrapolation depends very strongly on the distribution that is assumed, the uncertainty of this assumption is not included in the margins quoted. The model results below with more data points show that the tail of the distribution is likely thinner than a Normal distribution, which implies that the fits here may well underestimate the Risk Ratio, i.e. the change in the likelihood of the event occurring due to climate change.
Figure 2. Fits to the June temperature time series as described in the text of Tmean of Portugal, Spain, France, Switzerland, Belgium, the Central Netherlands and Central England; Tmax in Portugal and Spain. The red lines indicate the current climate, the blue ones the climate of around 1901. The purple symbol and lines indicate June 2017 (not included in the fits).
The results for the observed temperature in 2017 and return periods (including 95% Confidence Intervals, CI) of this value in the current climate are shown in Tables 1 and 2. The return periods are not very high, around 10 years (10% chance per year) in the northern countries and Switzerland to around 20 years (5% chance per year) in France, Spain and Portugal. This means that we can expect another hot June like this before too long. The maximum temperature averaged over Spain was more exceptional, around 80 years, almost certainly more than 30 years (less than 3% chance every year).
Table 1. Observer/forecast value and return period of June 2017
| Country (rank) Tmean | Observed / forecast Tmean, anomaly | Return period in current climate | 95% CI on return period |
|---|---|---|---|
| Portugal (1) | 23. 2 ºC 2.9 ºC 2 ºC 2.9 ºC |
25 yr (4 %/yr) | 10 … 110 yr |
| Spain (1) | 22.7 ºC 3.0 ºC | 35 yr (3 %/yr) | 13 … 150 yr |
| France (1/2*) | 19.9 ºC 2.9 ºC | 30 yr (3 %/yr) | 12 … 140 yr |
| Switzerland (2) | 15.2 ºC 3.2 ºC | 20 yr (5%/yr) | 7 … 130 yr |
| Belgium (~5) | 18.1 ºC 2.0 ºC | 9 yr (11 %/yr) | 2.5 … 45 yr |
| Central Netherlands (1) | 18.5 ºC 2.8 ºC | 20 yr (5 %/yr) | 8 … 70 yr |
| Central England (~4) | 16.4 ºC 1.9 ºC | 15yr (7 %/yr) | 7 … 50 yr |
| Tmax | |||
| Portugal (1) | 30.2 ºC 4.2 ºC | 20 yr (5 %/yr) | 10 … 80 yr |
| Spain (1) | 30.6 ºC 4.3 ºC | 80 yr (1 %/yr) | 30 … 500 yr |
* The CRU TS 4.00 / E-OBS v15.0+ / ECMWF series gives the highest value, the Météo France “heat index” series based on 30 non-public stations the second-highest.
The fit also allows us to compare the probability in the climate around 1901 (i.e., with a global mean temperature as observed around 1901) with the climate of today. We emphasise again that this extrapolation is very uncertain in the southern countries and may well lead to an underestimation of the Risk Ratio.
Table 2. Risk Ratios estimated from observed trends.
| Country Tmean | Risk Ratio (p1/p0) | 95% CI on RR | ∆T, change in magnitude | 95% CI on ∆T |
|---|---|---|---|---|
| Portugal | 2000 | 300 … 30000 | 2.4 ºC | 1.8 … 3.0 ºC |
| Spain | 9000 | 1000 … 300000 | 2.6 ºC | 2.0 … 3.2 ºC |
| France | 200 | 30 … 2000 | 1.8 ºC | 1.2 … 2.4 ºC |
| Switzerland | 150 | 30 … 900 | 2.4 ºC | 1.5 … 3.1 ºC |
| Belgium | 8 | 2.4 … 40 | 1.1 ºC | 0.5 … 1. 8 ºC 8 ºC |
| Central Netherlands | 30 | 6 … 250 | 1.6 ºC | 0.9 … 2.3 ºC |
| Central England | 4 | 1.3 … 13 | 0.7 ºC | 0.1 … 1.2 ºC |
| Tmax | ||||
| Portugal | 1400 | 150 … 20000 | 3.3 ºC | 2.4 … 4.1 ºC |
| Spain | 25000 | 1500 … 1000000 | 3.2 ºC | 2.5 … 3.9 ºC |
Furthermore, the Risk Ratio estimates have large uncertainties due to the relatively small number of data points (for most countries 116). However, they are always (much) larger than one, showing that the probability of observing a temperature as high as in 2017 or higher has increased, in many regions strongly, over the past century.
Attribution — model results
The next step in our analysis is to assess whether and to what extent external drivers, in particular anthropogenic climate change, caused this positive June temperature trend in the observational data. Answering this question requires the use of climate models, in which the relative impact of various external “forcings” such as changes in solar insolation, volcanoes, and greenhouse gas concentrations can be quantified. We need to use climate models because the observational record can assess correlation (is there a trend?) but not causation (what caused the trend?).
For this analysis we looked at five different climate models and modelling initiatives respectively (weather@home, HadGEM3-A, EC-Earth 2.3, CMIP5 and CORDEX). CMIP5, the “5th Coupled Model Intercomparison Project” (Taylor et al. 2012), is a collection of coordinated experiments from climate models run at centers across the world and is used in the IPCC Fifth Assessment Report. The EC-Earth 2.3 model, which also forms part of the CMIP5 ensemble, was run 16 times at KNMI. The CORDEX ensemble of Regional Climate Model (RCM) runs downscales CMIP5 runs from 1950-2100 to much higher resolutions over Europe (11km). 11 bias-adjusted ensemble members of the European CORDEX branch EURO-CORDEX (www. euro-cordex.net) are used in this analysis. Two further ensembles of atmosphere-only models are used: the UK Met Office HadGEM3-A model at N219 (60km) and the very large ensemble of Oxford’s weather@home runs of HadRM3P simulations at (50km). These models are all run with and without (the “counterfactual”) human-caused emissions of greenhouse gases and aerosols, allowing us to isolate and quantify the influence of human-induced climate change on the likelihood of June warm spells within the climate models.
weather@home
Using the distributed computing framework known as weather@home (Massey et al. 2015), we simulate two different large ensembles of June 2017 using the Met Office Hadley Centre regional climate model HadRM3P at 50km resolution over Europe embedded in the atmosphere-only global circulation model HadAM3P. The first set of ensembles represents possible June weather under current climate conditions. This ensemble is called the “all forcings” scenario and includes human-caused climate change. The second set of ensembles represents possible June weather in a world as it might have been without anthropogenic climate drivers. This ensemble is called the “natural” or “counterfactual” scenario.
As weather@home is an atmosphere-only modelling framework, observed sea surface temperatures (SSTs) are necessary to drive the model. SSTs for the “natural” simulations are obtained by subtracting various estimates of the difference between pre-industrial and present-day conditions from CMIP5 (Schaller et al., 2014). As observed SSTs are not yet available at the time of writing, the model is forced using seasonal forecast SSTs from the Met Office forecasting system GloSEA5 (Haustein et al., 2016). While biased warm in most countries, the distribution of average June temperatures compares well with observed distributions of June temperatures in the analyzed countries apart from the southernmost, Spain and Portugal, where the bias is cold. While the distribution and variability in the model climatology compare well with observations, the difference in June temperatures between the all forcings and counterfactual simulations is only about 1 ºC suggesting the counterfactual simulations underestimate the trend from human-induced warming. Results from weather@home simulations thus are likely a very conservative estimate of the risk ratio. Return periods of June temperatures in the two ensembles as well as the climatology are shown in Figure 3 as well as the risk ratios and their change with return period. Table 3 shows the risk ratios for the observed June 2017 events.
It is to be expected that the changes in probability in the atmosphere-only simulations do not exactly compare with observations and coupled model simulations. While observations and coupled models include changes due to natural variability and, in case of the observations other forcings, the atmosphere-only simulations of an individual year allow the change in probability due to anthropogenic forcings alone to be quantified. Everything else, including SST patterns, is kept the same. However, compared to the trend from human-induced warming, these other influences are small (at least over Europe) and thus cannot explain the discrepancies to trends in observations.
Figure 3. Left-hand side: Return periods of June mean temperatures for the seven analyzed countries in three different weather@home ensembles: the “all-forcings” for 2017 (red), the “counterfactual” simulations for June 2017 (blue) and the climatology of average June temperatures from 1986-2015 (black). Right-hand side: risk ratios between the “all-forcings” and “counterfactual” simulations depending on the return time.
Table 3. Risk ratios from weather@home for the observed 2017 events in the seven analyzed countries. Changes in magnitude for all countries are approx. 1°C.
| Tmean | Risk Ratio | 95% CI |
|---|---|---|
| Portugal | 8.5 | 5.6…12.8 |
| Spain | 8.7 | 5…17.2 |
| France | 2.7 | 2.1…3.6 |
| Switzerland | 2.3 | 1.9…2.9 |
| Belgium | 2.2 | 1.8…2.5 |
| Central Netherlands | 2. 5 5 |
2…3.2 |
| Central England | 2.8 | 2.3…3.3 |
| Tmax | ||
| Portugal | 3.8 | 2.9…4.9 |
| Spain | 5.1 | 2.8…13.2 |
CIMP5
For the CMIP5 analysis, we first checked which of the 15 models (Taylor et al. 2012; Table 4) with the required simulations for the analysis have a temperature anomaly distribution that is compatible with the observed distribution (following the method of Lewis and Karoly 2013; King et al. 2015). Temperature anomalies were extracted from the observational data (1961-1990 baseline) and compared with historical model simulations using the same baseline. The number of models used in each regional analysis is shown in Table 5. This evaluation process was done over seven regions for June mean temperature (Tmean) and over two regions (Spain and Portugal) for June average maximum temperature (Tmax).
The change in the likelihood of hot June temperatures (above the the observed June 2017 temperature anomalies) was computed between a natural model ensemble, based on historicalNat simulations, and an all-forcings current-world ensemble, based on RCP8. 5 for 2006-2026. The Risk Ratio for hot June temperatures in the current world relative to the natural world was calculated using all available model simulations (shown as the best estimate in Table 5) and on 10000 bootstrapped sub-ensembles so the sampling uncertainty could be quantified. The resulting 95% confidence intervals in the Risk Ratios are also shown in Table 5.
Changes in intensity of extreme heat events were estimated by finding the location of June 2017 in the statistical distribution from the current-world ensemble and finding the corresponding point in the natural-world ensemble. The best estimate of this change is shown in Table 5.
Table 4. CMIP5 model simulations used in this analysis
| Model | Historical | HistoricalNat | RCP2.6 | RCP4.5 | RCP6.0 | RCP8.5 |
|---|---|---|---|---|---|---|
| ACCESS1-3 | 1,2,3 | 1 | 1 | 1 | ||
| bcc-csm1-1 | 1,2,3 | 1 | 1 | 1 | 1 | 1 |
| CanESM2 | 1,2,3,4,5 | 1,2,3,4,5 | 1,2,3,4,5 | 1,2,3,4,5 | 1,2,3,4,5 | |
| CCSM4 | 1,2,3,4,5,6 | 1,2,4,6 | 1,2,4,6 | 1,2,4,6 | 1,2,4,6 | 1,2,4,6 |
| CESM1-CAM5 | 1,2,3 | 1,2,3 | 1,2,3 | 1,2,3 | 1,2,3 | 1,2,3 |
| CNRM-CM5 | 1,2,3,4,5,6,7,8,9,10 | 1,2,4 | 1 | 1 | 1,2,4 | |
| CSIRO-Mk3-6-0 | 1,2,3,4,5,6,7,8,9,10 | 1,2,3,4,5 | 1,2,3,4,5 | 1,2,3,4,5 | 1,2,3,4,5 | 1,2,3,4,5 |
| GFDL-CM3 | 1,2,3,4,5 | 1 | 1 | 1 | 1 | 1 |
| GISS-E2-H | 1,2,3,4,5 | 1,2 | 1 | 1,2 | 1 | 1,2 |
| HadGEM2-ES | 1,2,3,4,5 | 1,2,3,4 | 1,2,3,4 | 1,2,3,4 | 1,2,3,4 | |
| IPSL-CM5A-LR | 1,2,3,4,5,6 | 1,2,3 | 1,2,3 | 1,2,3 | 1 | 1,2,3 |
| IPSL-CM5A-MR | 1,2,3 | 1 | 1 | 1 | 1 | 1 |
| MIROC-ESM | 1,2,3 | 1 | 1 | 1 | 1 | 1 |
| MRI-CGCM3 | 1,2,3 | 1 | 1 | 1 | 1 | 1 |
| NorESM1-M | 1,2,3 | 1 | 1 | 1 | 1 | 1 |
Table 5. Risk Ratios (best estimate and 95% confidence intervals) for hot June temperatures in model simulations representing the current world compared with a counterfactual natural world.
| Country | Number of models | Best estimate Risk Ratio | 95% CI | Best estimate Change in Magnitude (degrees C) |
|---|---|---|---|---|
| Belgium | 6 | 3 | 1.2 … 5.3 | 1.03 |
| CET | 9 | 5.7 | 3.6 … 9.5 | 1.35 |
| France | 13 | 6.3 | 2.8 … 20 | 1.32 |
| Netherlands | 14 | 5.5 | 2.7 … 11.3 | 1.18 |
| Portugal T | 13 | 15.6 | 5 … 78 | 1.56 |
| Portugal TX | 14 | 8.6 | 2.9 … 70 | 1.78 |
| Spain T | 11 | 50 | 10 … Inf | 1.59 |
| Spain TX | 7 | 30 | 5 … Inf | 1. 96 96 |
| Switzerland | 13 | 8 | 3.75 … 50 | 1.65 |
The likelihood of high June temperatures similar to those we have seen in 2017 is estimated for two future scenarios. Model ensembles representing global warming of 1.5-degrees C and 2-degrees C above a pre-industrial baseline were extracted from the model projections (following King et al. (2017)). These ensembles were used to examine the likelihood of high June temperatures at the policy-relevant Paris global warming targets (Figure 4).
Figure 4: Estimates of the likelihood of high June temperatures in each European region under each of the four scenarios for mean temperatures (T) and maximum temperatures (TX). Best estimates are shown with 90% confidence intervals in parentheses.
EC-Earth 2.3
EC-Earth 2.3 is a coupled atmosphere-ocean general circulation model ensemble with 16 members (Hazeleger et al. 2010), each producing a transient climate simulation from 1860 to 2100. The model resolution is T159 which translates to around 150 km in the European domain. The underlying scenarios are the historical CMIP5 protocols until the year 2005 and the RCP8.5 scenario (Taylor et al. 2012) from 2006 onwards. Up to about 2030, the historical and RCP8.5 temperature evolution is very similar. As for the observations, we fit all modelled June temperatures to a distribution that shifts proportionally to the modelled global mean temperature (smoothed per ensemble member). We use all years up to 2017 to investigate the event in the recent and past climate, and the entire ensemble up to 2100 to investigate the event in the future climate.
For the EC-Earth analysis we checked for each region separately that the model has a temperature distribution that is compatible with the observed one, after a bias correction in the June mean temperature. We do this by fitting the data to a Normal distribution and comparing the scale parameter, allowing for a bias in the mean. For the bias correction we compare the modelled mean June temperatures between 1900-2016 with the mean June temperature of CRU TS data, and add the difference to the model. After that the model data is fitted to a General Pareto Distribution (GPD), because this fits the highest temperatures better than a Normal distribution. The fits are shown in Figure 5 as a function of the model global mean temperature, and as a function of the return period for the climates of 1900 and 2017. The Risk Ratios between 2017 and 1900 are shown in Table 6. Upper bounds are not always well-defined because the return periods in the climate of 1900 are very high.
By the year 2100, under the assumption of the RCP8.5 scenario, for all regions the June 2017 temperatures will be normal, occurring almost every year.
Table 6. Risk Ratios calculated from EC-Earth model data, calculated with a GPD distribution
| Tmean | RR | 95% CI | ∆T | 95% CI |
|---|---|---|---|---|
| Portugal | 16 | 8 … 2000 | 1.2 | 1.1 … 2.3 |
| Spain | 70 | 20 … ∞ | 1.7 | 1.5 … 2.1 |
| France | 50 | 20 … 900 | 1. 6 6 |
1.4 … 1.9 |
| Switzerland | 140 | 17 … ∞ | 1.6 | 1.2 … 2.0 |
| Belgium | 3 | 2 … 5 | 0.6 | 0.4 … 1.0 |
| Central Netherlands | 35 | 12 … 400 | 1.5 | 1.3 … 2.2 |
| Central England | 14 | 9 … 76 | 1.466 | 1.271 … 2.205 |
| Tmax | ||||
| Portugal | 40 | 9 … ∞ | 1.536 | 1.223 … 1.803 |
| Spain | 170 | 27 … ∞ | 2.074 | 1.884 … 2.555 |
Figure 5. GPD Fits to the June temperature EC-Earth series as described in the text, for Tmean of Portugal, Spain, France, Switzerland, Belgium, the Central Netherlands and Central England; Tmax in Portugal and Spain. The red lines indicate the current climate, the blue ones the climate of 1900. The purple symbol and lines indicate the magnitude of the observed event of June 2017.
HadGEM3-A
The 15 HadGEM3-A coupled historical runs 1960–2015 (Christidis et al, 2013) (N216, about 60km) are evaluated for the separate regions. The model turns out to have a too high variability. Therefore we reject this model for this analysis and do not use this model for calculations on the Risk Ratio.
CORDEX
A subsample from the EURO-CORDEX ensemble (Jacob et al., 2014) was used in order to calculate the change in odds of an exceedance of the observed mean temperature in the different countries. Ten 11-km GCM-RCM model combinations were considered, made available through the Copernicus Climate Change Service project CLIM4ENERGY. Simulations were bias adjusted using the Watch Forcing Data Era Interim (WFDEI, Weedon et al., 2014) and applying the so-called CDFt method (Vrac et al., 2016). By construction, daily temperatures were corrected and verifications were made against station data (Vautard et al., 2017, in preparation).
Return periods were estimated by pooling the 10 models together and using data in 30-year periods, 1971-2000 for past periods and 2001-2030 for the “current period”. Through this pooling we obtain an ensemble of 300 simulations of the month June from which return periods of the events with the observed magnitude were calculated for each respective ensemble and sampling uncertainty was estimated using the same bootstrapping procedure as for weather@home simulations keeping the full time series in the random drawings.
For this ensemble we also used two future periods in order to understand how the likelihood of extreme June temperatures would evolve under the RCP8.5 concentration scenario.
In this ensemble, the high temperatures observed in Western Europe in 2017 would have been rare events with return periods close to a hundred years at the end of the 20th century (see Figure 6). In the current climate, the likelihood of events like the observed to occur generally increased by varying factors from 2 to 6 depending on the country corresponding to a 1-to-10 to 1-to-20 year event today (see Table 7). This factor, the Risk Ratio, would apply again comparing today’s climate with future periods (2021-2050 and 2041-2070), with a likelihood increase by typically a factor 2 for the near future and 4 for the middle of the century relative to the current climate. Therefore in the absence of climate policies, one would expect such events to occur about once in 3 years in several countries.
It is interesting to remark that in many of the countries, there is a relative divergence of the return period curves with the increase in risk being higher for rare events. This may be due to soil-atmosphere interactions inducing positive feedback between drought and heat waves (Seneviratne 2010).
Figure 6. Return periods of June mean temperatures for the seven analyzed countries in four different CORDEX ensemble simulations: 1971-2000 (blue), 2001-2030 (red), 2021-2050 (yellow) and 2041-2070 (purple).
Table 7. Risk Ratios for the EURO-CORDEX experiment
| Country | Risk Ratio | Conf. Interval 5-95% |
|---|---|---|
| Portugal (1) | 3.6 | 2.3 … 7.6 |
| Spain (1) | 5.0 | 2.7 … 21.5 |
| France (1) | 3.7 | 2.3 … 8.9 |
| Switzerland (2) | 6. 3 3 |
3.9 … 13.6 |
| Belgium (4) | 2.2 | 1.7 … 3.3 |
| Central Netherlands (1) | 3.5 (NL) | 1.7 … 8.0 |
The same bias-adjusted EURO-CORDEX ensembles for RCPs 4.5 and 8.5 have been employed to provide a European-scale picture on the future (end of 21st Century) likelihood of mean June temperatures to exceed the maximum mean June temperature of a historical reference period (1981-2010). By definition, the latter has an empirical probability to occur once in 30 years in 1981-2010. Results reveal that already for the moderate RCP4.5 emission scenario probabilities are larger than 10% (i.e., at least once in 10 years) over the entire European continent (Figure 7, left panel). Regions along the Mediterranean coast and in Northern Europe can show probabilities exceeding 40%. Even higher values are obtained for RCP8.5 (Figure 7, right panel). Over large parts of the continent, the probability for mean June temperatures to exceed the reference period’s maximum is larger than 50% and can reach values of more than 80% in Southern Europe. Mean June temperatures that are exceptional in a today’s climate would appear regularly by the end of the century with potentially drastic impacts on human health.
Figure 7: Probability for mean June temperature in the period 2070-2099 to exceed the maximum mean June temperature of a reference period’s climate (here 1981-2010). Left panel: RCP4.5, right panel: RCP8.5. Shown are ensemble mean probabilities as provided by bias-adjusted EURO-CORDEX regional climate scenarios.
Synthesis
Figure 8 shows the estimates of the change in risk for the different methodologies with model results in red and observations in blue. The synthesis result in magenta does not include the CORDEX and weather@home results. In weather@home the warming trend is not compatible with the observed trend whereas the simulations in CORDEX are very different in terms of the actual time period simulated that a quantitative comparison is not meaningful.
Figure 9: Same as Figure 8 but for the average maximum temperatures in Spain and Portugal.
Figures 8 and 9 summarise all the results on the change in probability from the observed trend (blue) and the model ensembles (red). We computed a unweighted average of all results, but excluding the two model results where the trends are incompatible with the observations (CORDEX and weather@home) this is shown in magenta. In all seven countries the likelihood of hot Junes has increased significantly. In all countries the observed changes in the likelihood of the event, average June temperatures as high as 2017, are much larger than in the model simulations with the regional models in weather@home and CORDEX showing the lowest increase in risk. As June temperatures were more extreme in Portugal and Spain it is not surprising that increases in Risk Ratios are higher for these countries. In Gaussian distributed variables or GPD distributions with negative shape parameter the dependency on the exact threshold is strongest further in the tail of the distribution.
Still, the difference between the Risk Ratios derived from observations and most models is sizeable. As we verified that the variability is similar (we rejected a model with too high variability) and as we corrected for biases in the mean, this is mainly due to differing estimates of the effect of anthropogenic emissions on summer temperatures in Europe. This difference is especially large in Tmax in Portugal and Spain. The discrepancy was found for CMIP3 models in southern Europe (van Oldenborgh et al, 2009) and also present for 3-day extremes in the summer of 2015 (Sippel et al, 2016). The cause for the differing trends is unknown. A first possibility is inhomogeneous observations, although the time series for Switzerland and the Netherlands are based on homogenised series. Part of the discrepancy could be due to random weather fluctuations, even though the high value for 2017 that is not included in the trend estimate is evidence against that. There could be decadal or longer time scale variability, but the autocorrelations of the residuals are compatible with white noise after subtracting the trend as a factor times the smoothed global mean temperature (in Belgium there is a step downward around 1950, whilst the CNT and CET show relatively cool weather in the 1970s and 1980s connected to air pollution). Finally, there may be model deficiencies in this area that cause a trend underestimation. However, for the whole SREX MED (Mediterranean) region, observed trends agree well with CMIP5. Maybe all these explanations contribute somewhat.
In any case, despite the spread, we can conclude that the probability of a June temperature as high as observed in 2017 or higher has increased by a factor more than ten due to global warming in Portugal and Spain, and at least doubled in the other analyzed countries.
Conclusion
The model results indicate that past historical increases in greenhouse gases have raised the odds of a warm June in Belgium, France, the Netherlands, Portugal, Spain, Switzerland and central England considerably (see Table 8). The observed trend is compatible with the effects of human-induced emissions of greenhouse gases. Since past and projected future greenhouse gas increases will continue to raise the temperatures, the frequency of summer months like June 2017 should be expected to increase over the coming decades and what is still an unusually hot June today would be a normal June later this century.
Table 8. Synthesis estimates of Risk Ratio from pre-industrial to today for average June temperatures, as shown in Figure 8 and 9.
| Country | Change in odds from pre-industrial to today |
|---|---|
| Belgium | 4 (2…10) |
| France | 40 (10…300) |
| The Netherlands (CNT region) | 18 (6…100) |
| Portugal (Tmean) | 80 (20…1800) |
| Portugal (Tmax) | 70 (20…241000) |
| Spain (Tmean) | 320 (60…∞) |
| Spain (Tmax) | 500 (60…∞) |
| Switzerland | 50 (10…16400) |
| United Kingdom (CET region) | 7 (4…20) |
As the intensity and frequency of extreme heat events increases, many countries in Europe have made efforts to reduce vulnerability to extreme heat. For example, following the deadly 2003 heat wave, France implemented a national heat wave plan that included health monitoring activities, public cooling centers, home visiting plans for the elderly living alone and other actions that reduced mortality in subsequent heat waves (Murray et al. 2012). While we won’t know the mortality and morbidity impacts of the current heat wave until pubic health records are made available, it’s likely that many impacts were avoided as a result of heat wave action plans (Fouillet et al., 2008). At the same time, efforts to optimize the performance of heat wave watch and warning plans will be key to managing the vulnerability of populations as the frequency of extreme heat wave events increases.
References
Fouillet, A., Rey, G., Wagner, V., Laaidi, K., Empereur-Bissonnet, P., Le Tertre, A., Frayssinet, P., Bessemoulin, P., Laurent, F., De Crouy-Chanel, P., Jougla, E. and Hémon, D. (2008) Has the impact of heat waves on mortality changed in France since the European heat wave of summer 2003? A study of the 2006 heat wave. International Journal of Epidemiology, 37(2): 309–17. doi: 10.1093/ije/dym253
Haustein, K., Otto, F.E.L., Uhe, P., Schaller, N., Allen, M.R., Hermanson, L., Christidis, N., McLean, P. and Cullen, H. (2016) Real-time extreme weather event attribution with forecast seasonal SSTs. Environmental Research Letters, 11(6): doi: 10.1088/1748–9326/11/6/064 006
King, A. D., Karoly, D.J. and Henley, B.J. (2017) Australian climate extremes at 1.5 and 2 degrees of global warming. Nature Climate Change, 7, 412–416. doi: 10.1038/nclimate3296
King, A. D., van Oldenborgh, G.J., Karoly, D.J., Lewis, S.C. and Cullen, H. (2015) Attribution of the record high central England temperature of 2014 to anthropogenic influences. Environmental Research Letters, 10(5): 054002. doi: 10.1088/1748-9326/10/5/054002
Lewis, S. C., and D. J. Karoly. (2013) Anthropogenic contributions to Australia’s record summer temperatures of 2013. Geophysical Research Letters, 40: 3705–3709. doi: 10.1002/grl.50673
Murray, V., McBean, G., Bhatt, M.,Borsch, S., Cheong, T.S., Erian, W. F., Llosa, S., Nadim, F., Nunez, M., Oyun, R. and Suarez, A. G. (2012) Chapter 9: Case studies. In: Managing the Risks of Extreme Events and Disasters to Advance Climate Change Adaptation. A Special Report of Working Groups I and II of the Intergovernmental Panel on Climate Change (IPCC). Cambridge University Press.
van Oldenborgh, G.J., Drijfhout, S., van Ulden, A., Haarsma, R., Sterl, A., C. Severijns, C., Hazeleger, W. and Dijkstra, H. (2009) Western Europe is warming much faster than expected. Climate of the Past, 5: 1–12. doi: 10.5194/cp-5-1-2009
Schaller, N., Otto, F.E.L., van Oldenborgh, G.J., Massey, N.R., Sparrow, S. and Allen, M.R. (2014) The heavy precipitation event of May–June 2013 in the upper Danube and Elbe basins [in Explaining Extreme Events of 2013 from a Climate Perspective]. Bulletin of the American Meteorological Society, 95(9): S69–S72.
Seneviratne, S.I., Corti, T., Davin, E.L., Hirschi, M., Jaeger, E. B., Lehner, I., Orlowsky, B. and J.Teuling, A.J. (2010) Investigating soil moisture – climate interactions in a changing climate: A review. Earth-Science Reviews, 99( 3–4): 125–161. doi: 10.1016/j.earscirev.2010.02.004
Sippel, S., Otto, F. E. L., Flach, M. and van Oldenborgh, G. J. (2016) The role of anthropogenic warming in 2015 Central European heat wave. Bulletin of the American Meteorological Society, 97, S51–S56, doi: 10.1175/BAMS-D-16-0150.1.
Suckling, E.B., van Oldenborgh, G.J., Eden, J.M. and Hawkins, E. (2017) An empirical model for probabilistic decadal prediction: global attribution and regional hindcasts. Climate Dynamics, 48: 3115. doi: 10.1007/s00382-016-3255-8
Massey, N., Jones, R., Otto, F.E.L., Aina, T., Wilson, S., Murphy, J.M., Hassell, D., Yamazaki, Y.H. and Allen, M.R. (2015) weather@home— development and validation of a very large ensemble modelling system for probabilistic event attribution.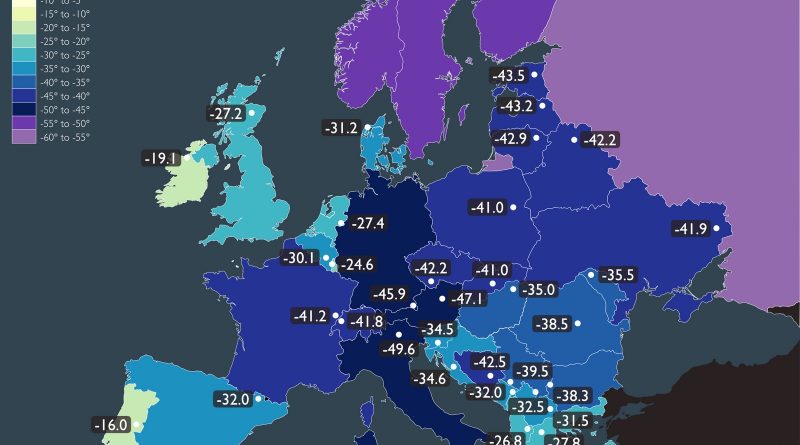 Quarterly Journal of the Royal Meteorological Society, 141: 1528–1545. doi: 10.1002/qj.2455
Taylor, K.E., Stouffer, R.J. and Meehl, G.A. (2012) An overview of CMIP5 and the experiment 962 design. Bulletin of the American Meteorological Society, 93: 485–498. doi: 10.1175/BAMS-D-11-00094.1
European heatwave update: drought and extended-range forecasts
This chart shows information regarding probabilities for the 7-day mean anomalies of air temperature at 2 m to be in the lower or upper parts of several selectable categories derived from the ECMWF ensemble (ENS).
Another heatwave is currently affecting most of Europe with various and very high intensity levels. This follows heatwave conditions across Europe earlier this summer, which have now contributed to large parts of Europe also experiencing severe drought conditions.
The drought that started in early summer as a consequence of low precipitation amounts over four consecutive seasons across Europe is persisting into late summer. The precipitation deficit is still severe, causing low soil moisture, high vegetation stress, low river flows and water shortages in many areas across Europe. The extended-range hydrological forecasts from the Copernicus Emergency Management Service show that this situation is likely to continue into the late summer for most of western Europe.
EFAS sub-seasonal forecast with the severe low flow signal in many parts of Europe in the next six weeks, with the inset hydrograph highlighting the evolution of weekly mean river discharge in the southern part of the UK.
The surge of heat of 11–13 August, mainly affecting northern Spain, western France, Ireland and UK, can be seen in the short-range Extreme Forecast Index (EFI) for 2-metre temperature. Looking at the forecast issued one week ahead (5 August), the EFI product captured well the spatial pattern of the heatwave and gave a reasonable early warning for the event. The EFI product also highlights the very warm sea in the western Mediterranean.
These charts aim to provide pointers to areas where anomalous values of 2 m temperature are likely to occur based on the ECMWF ensemble forecast (ENS) system. You can access animated EFI charts here, where you can select desired times and climatology quantiles using the drop down menu. Date/time can also be selected using the slider underneath the chart or the play/pause symbols at the bottom left of the chart.
Our extended-range forecasts provide a broader overview for the coming four to six weeks. These forecasts are generally provided as seven-day averages in terms of anomalies relative to what is expected for the time of year.
For example, the 2 m temperature: Weekly mean anomalies chart shows for this week temperatures up to 10°C higher than average in parts of northern Spain, western France and southern England. Much of northern Spain, France, the UK, Belgium, Luxemburg, the Netherlands and western Germany will be up to 6°C higher than average. Next week, these extremes will have mostly dissipated, although a large part of northern Europe is predicted to see temperatures 3°C higher than average. Over the following weeks, this area of warmer-than-average temperatures moves to western Europe where it remains into September.
Despite the continuing warm weather, drought conditions are expected to ease over the next few weeks. Our Precipitation: Weekly mean anomalies product shows that, while this week precipitation remains at 30% lower than average over much of northern Europe, and as much as 60% lower in some regions, next week will bring higher-than-average precipitation to a region stretching from Scandinavia, across much of the UK, through France to the Mediterranean Basin. Parts of eastern Europe will also see higher-than-average precipitation. In late August, Portugal, Spain and parts of western France will see two weeks of lower-than-average precipitation. By early September, however, precipitation will be around average for most parts of Europe.
Screenshot of chart showing the seven-day mean anomaly of precipitation (in mm) for Monday 15 August to 22 August 2022. It can be seen that conditions will be close to average for much of Europe, with some areas experiencing slightly higher-than-average precipitation.
Looking further ahead still, our long-range, or seasonal, forecasts, which provide information on conditions up to seven months ahead, show that warmer-than-average temperatures are likely to persist over much of Europe until October, with southern and northern regions experiencing warmer-than-average temperatures to the end of the year. Precipitation is likely to remain lower than average in Portugal, as well as western parts of Spain and France.
ECMWF is actively working on improving the seasonal forecasts of extreme weather, such as droughts and heatwaves, for example, by collaborating with scientists across Europe in the CAFE project. In addition, ECMWF is providing open-source tools to calculate and compute thermal indices to assess heat impacts for weather forecasts.
Further reading on the Copernicus Atmosphere Monitoring Service website: Intense wildfire activity in southwestern Europe amid heatwaves and dry conditions.
Climate of Europe: Temperature, climate graph, Climate tables for Europe
- Albania
- Andorra
- Armenia
- Austria
- Azerbaijan
- Belarus
- Belgium
- Bosnia and Herzegovina
- Bulgaria
- Croatia
- Cyprus
- Czech Republic
- Denmark
- Estonia
- Faroe Islands
- Finland
- France
- Georgia
- Germany
- Gibraltar
- Greece
- Guernsey
- Hungary
- Iceland
- Ireland
- Isle of Man
- Italy
- Jersey
- Kazakhstan
- Latvia
- Liechtenstein
- Lithuania
- Luxemburg
- Macedonia
- Malta
- Moldova
- Monaco
- Montenegro
- Norway
- Poland
- Portugal
- Republic of Kosovo
- Romania
- Russian Federation
- San Marino
- Serbia
- Slovakia
- Slovenia
- Spain
- Sweden
- Switzerland
- The Netherlands
- Turkey
- Ukraine
- United Kingdom
Europe has many different climates, but is dominated by Dfb.
Classifications
| Classification | Count | Köppen-Geiger | Examples |
|---|---|---|---|
| Warm humid continental climate | 479929 | Dfb |
Astana, Karaganda, Ust-Kamenogorsk, Pavlodar, Hakodate |
| Oceanic climate | 331986 | Cfb |
Melbourne, Johannesburg, Soweto, Port Elizabeth, Canberra |
| Hot-summer Mediterranean climate | 75750 | Csa |
Istanbul, Allahabad, Lucknow, Varanasi, Izmir |
| Humid subtropical climate | 38850 | Cfa |
Tokyo, Hanoi, Sydney, Yokohama, Durban |
| Warm-summer Mediterranean climate | 31122 | Csb |
Cape Town, Mitchells Plain, Blue Downs, Bellville, Elsiesrivier |
| Hot humid continental climate | 19719 | Dfa |
Sapporo, Almaty, Aktobe, Sinŭiju, Matsumoto |
| Warm humid continental climate | 19424 | Dsb |
Hacıbektaş, Kaza, Trespone, Gemur, Ağrı |
| Subarctic climate | 17738 | Dfc |
Stepantsminda, Kumlistsikhe, Karzok, Soldeu, Perisher Valley |
| Cold semi-arid climates | 9020 | BSk |
Baku, Ulaanbaatar, Yerevan, Asmara, Taraz |
| Hot humid continental climate | 5475 | Dsa |
Ankara, Shymkent, Taldykorgan, Kargil, Khovaling |
| Subarctic climate | 1018 | Dwc | |
| Hot semi-arid climates | 505 | BSh |
Delhi, New Delhi, Hyderabad, Ahmedabad, Pune |
| Tropical rainforest climate | 496 | Af |
Singapore, Medan, Kuala Lumpur, Pekanbaru, Wonosobo |
| Tundra climate | 384 | ET | |
| Tropical savanna climate | 342 | Aw |
Mumbai, ಬೆಂಗಳೂರು, Bangkok, Bengaluru, Ho Chi Minh City |
| Subpolar oceanic climate | 331 | Cfc | Miena |
| Subarctic climate | 259 | Dfd | |
| Tropical monsoon climate | 241 | Am |
Jakarta, Sylhet, Chittagong, Semarang, Makassar |
| Cold desert climates | 238 | BWk |
Aktau, Kyzylorda, Atyrau, Leh, Sumur |
| Hot desert climates | 120 | BWh |
Cairo, Alexandria, Giza, Dubai, Jodhpur |
| Warm humid continental climate | 108 | Dwb | |
| Subarctic climate | 64 | Dsc | Sarchu |
| Mediterranean climate | 33 | Cs | |
| Tropical savanna climate | 9 | As | |
| Dry-summer maritime subalpine climate | 4 | Csc |
Display all climates
Astana
The climate in Astana is cold and temperate.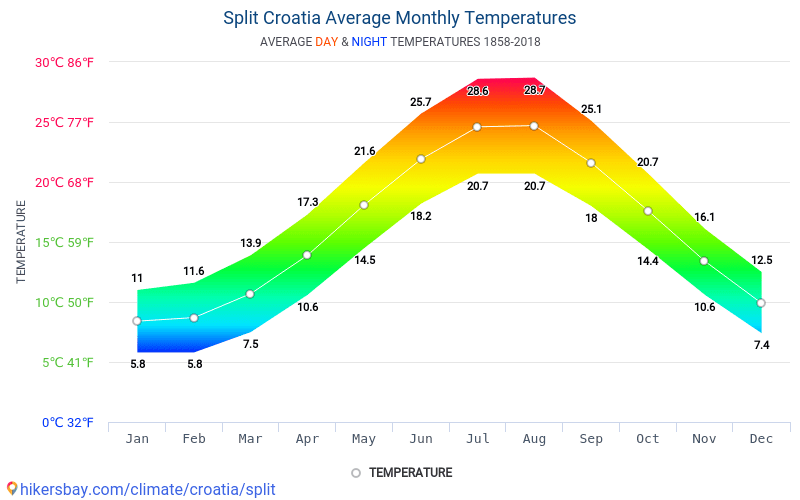 Astana has a significant amount of rainfall during the year. This is true even for the driest month. This location is classified as Dfb by Köppen and Geiger. The average annual temperature in Astana is 4.2 °C | 39.6 °F. About 401 mm | 15.8 inch of precipitation falls annually.
Graphs
Click one of the graphs for more information.
Karaganda
The climate in Karaganda is cold and temperate. In Karaganda there is a lot of rain even in the driest month. This climate is considered to be Dfb according to the Köppen-Geiger climate classification. The average annual temperature in Karaganda is 4.1 °C | 39.3 °F. In a year, the rainfall is 408 mm | 16.1 inch.
Graphs
Click one of the graphs for more information.
Ust-Kamenogorsk
In Ust-Kamenogorsk, the climate is cold and temperate. The rainfall in Ust-Kamenogorsk is significant, with precipitation even during the driest month. According to Köppen and Geiger, this climate is classified as Dfb. The average annual temperature in Ust-Kamenogorsk is 4.2 °C | 39.5 °F. Precipitation here is about 597 mm | 23.5 inch per year.
Graphs
Click one of the graphs for more information.
Pavlodar
The climate is cold and temperate. Pavlodar is a city with a significant rainfall. Even in the driest month there is a lot of rain. According to Köppen and Geiger, this climate is classified as Dfb. The average temperature in Pavlodar is 4.2 °C | 39.6 °F. The annual rainfall is 348 mm | 13.7 inch.
Graphs
Click one of the graphs for more information.
Hakodate
The climate here is mild, and generally warm and temperate. Hakodate has a significant amount of rainfall during the year. This is true even for the driest month. This location is classified as Cfb by Köppen and Geiger. The average annual temperature in Hakodate is 8.2 °C | 46.8 °F. In a year, the rainfall is 1209 mm | 47.6 inch.
Graphs
Click one of the graphs for more information.
Air temperature and precipitation by months and years: Europe Island
- Weather and climate
- Weather record
- Reunion
- Europe Island
WEATHER on Europa Island
- Weather forecast for Europa Island
- Europa Island weather monitor
- Current weather on Europa Island
- Weather archive on Europa Island
- Europe Island weather record
- Europe Island weather summary
- Climate Islands Europe
- Webcam on Europa Island
WEATHER RECORD on Europa Island
| 1951 |
| 1952 |
| 1953 |
| 1954 |
| 1955 |
| 1956 |
| 1957 |
| 1958 |
| 1959 |
| 1960 |
| 1961 |
| 1962 |
| 1963 |
| 1964 |
| 1965 |
| 1966 |
| 1967 |
| 1968 |
| 1969 |
| 1970 |
| 1971 |
| 1972 |
| 1973 |
| 1974 |
| 1975 |
| 1976 |
| 1977 |
| 1978 |
| 1979 |
| 1980 |
| 1981 |
| 1982 |
| 1983 |
| 1984 |
| 1985 |
| 1986 |
| 1987 |
| 1988 |
| 1989 |
| 1990 |
| 1991 |
| 1992 |
| 1993 |
| 1994 |
| 1995 |
| 1996 |
| 1997 |
| 1998 |
| 1999 |
| 2000 |
| 2001 |
| 2002 |
| 2003 |
| 2004 |
| 2005 |
| 2006 |
| 2007 |
| 2008 |
| 2009 |
| 2010 |
| 2011 |
| 2012 |
| 2013 |
| 2014 |
| 2015 |
| 2016 |
| 2017 |
| 2018 |
| 2019 |
| 2020 |
| 2021 |
| 2022 |
| Jan | Feb | mar | Apr | May | Jun | Jul | Aug | sep | Oct | Nov | dec | per year |
26. 4 4 |
26.2 | 25.7 | 24.9 | 23.3 | 22.0 | 20.6 | 21.3 | 22.1 | 24.1 | 25.1 | 26.8 | 24.0 |
| 27.0 | 27.5 | 26.7 | 25.8 | 24.1 | 22.4 | 21.8 | 22.6 | 23.1 | 24.7 | 24.6 | 25.7 | 24.7 |
| 27.6 | 27.3 | 26.9 | 25.6 | 23.9 | 22.2 | 20.8 | 21.1 | 21.9 | 23.7 | 25.9 | 26.7 | 24.5 |
| 27.7 | 27.6 | 26.3 | 24.6 | 23.6 | 21.5 | 21.4 | 21.4 | 22.9 | 24.7 | 25.3 | 26.7 | 24.5 |
27. 3 3 |
27.7 | 26.7 | 24.6 | 23.2 | 21.9 | 21.3 | 21.0 | 22.2 | 23.8 | 24.6 | 26.6 | 24.2 |
| 27.2 | 28.1 | 27.8 | 25.8 | 24.3 | 22.6 | 20.6 | 21.8 | 22.7 | 23.7 | 25.1 | 24.8 | 24.5 |
| 27.0 | 27.7 | 26.9 | 25.2 | 23.8 | 21.7 | 21.3 | 22.0 | 23.3 | 25.2 | 26.2 | 26.4 | 24.7 |
| 26.7 | 27.9 | 26.8 | 25.3 | 23.7 | 22.9 | 21.6 | 21.3 | 22.6 | 23.5 | 26.0 | 27.5 | 24.7 |
26. 9 9 |
27.9 | 27.3 | 24.3 | 23.2 | 21.9 | 22.0 | 22.0 | 22.8 | 23.9 | 25.2 | 27.1 | 24.5 |
| 26.7 | 27.4 | 26.8 | 25.0 | 22.9 | 22.1 | 20.9 | 21.5 | 23.1 | 24.9 | 25.7 | 26.9 | 24.5 |
| 27.2 | 28.1 | 27.7 | 27.1 | 24.4 | 23.9 | 23.0 | 22.6 | 23.5 | 24.6 | 24.8 | 26.4 | 25.3 |
| 27.9 | 27.3 | 26.6 | 26.2 | 23.0 | 21.3 | 21.6 | 22.4 | 22.5 | 24.8 | 26.3 | 26.7 | 24.7 |
27. 2 2 |
27.0 | 26.2 | 24.5 | 22.0 | 21.0 | 20.7 | 20.5 | 22.1 | 24.1 | 24.8 | 26.1 | 23.9 |
| 26.9 | 27.8 | 26.7 | 24.9 | 22.8 | 21.1 | 20.0 | 20.5 | 22.0 | 24.7 | 25.8 | 25.7 | 24.1 |
| 26.4 | 26.8 | 25.9 | 24.7 | 22.7 | 20.7 | 20.8 | 21.4 | 22.2 | 22.5 | 24.4 | 26.3 | 23.7 |
| 27.3 | 27.7 | 26.5 | 25.0 | 22.6 | 22.1 | 21.8 | 21.5 | 22.7 | 23.2 | 24.5 | 26.5 | 24.3 |
27. 4 4 |
27.9 | 27.1 | 26.3 | 24.3 | 23.1 | 21.7 | 22.2 | 22.6 | 24.5 | 24.9 | 25.9 | 24.8 |
| 27.4 | 26.7 | 26.7 | 24.1 | 22.9 | 20.8 | 20.7 | 21.3 | 22.2 | 23.7 | 24.5 | 26.2 | 23.9 |
| 27.4 | 27.9 | 27.5 | 25.6 | 23.3 | 21.1 | 21.3 | 22.1 | 21.6 | 24.8 | 25.4 | 26.5 | 24.5 |
| 27.6 | 27.2 | 26.4 | 24.6 | 22.6 | 21.9 | 21.3 | 22.4 | 23.2 | 24.0 | 25.6 | 26.8 | 24.5 |
27. 3 3 |
26.8 | 26.2 | 25.9 | 23.6 | 21.7 | 21.3 | 22.2 | 22.5 | 23.4 | 24.5 | 26.1 | 24.3 |
| 27.6 | 26.2 | 26.5 | 25.6 | 24.1 | 21.3 | 21.1 | 21.1 | 22.1 | 23.7 | 24.0 | 26.6 | 24.2 |
| 27.8 | 27.2 | 27.2 | 25.6 | 22.7 | 22.2 | 20.8 | 21.5 | 21.9 | 24.3 | 25.0 | 26.4 | 24.4 |
| 27.5 | 27.6 | 27.5 | 25.2 | 23.6 | 22.1 | 21.4 | 21.6 | 21.9 | 23.7 | 25.4 | 26.3 | 24.5 |
26. 7 7 |
27.0 | 26.4 | 25.0 | 23.4 | 22.0 | 21.2 | 21.5 | 22.7 | 23.3 | 24.8 | 26.7 | 24.2 |
| 27.4 | 27.5 | 27.8 | 25.6 | 24.0 | 21.8 | 20.9 | 21.7 | 21.5 | 23.4 | 25.8 | 26.6 | 24.5 |
| 27.8 | 27.8 | 26.7 | 25.3 | 24.2 | 21.7 | 21.7 | 21.7 | 23.2 | 24.3 | 26.0 | 27.8 | 24.9 |
| 29.1 | 28.6 | 28.1 | 25.9 | 23.5 | 22.6 | 21.3 | 22.4 | 23.1 | 25.2 | 25.8 | 26.6 | 25.2 |
26. 9 9 |
28.8 | 27.6 | 25.9 | 23.7 | 22.0 | 21.3 | 22.1 | 23.3 | 24.7 | 25.4 | 26.3 | 24.8 |
| 27.2 | 27.9 | 27.6 | 25.8 | 23.3 | 21.6 | 21.0 | 21.8 | 22.9 | 23.8 | 26.1 | 27.1 | 24.7 |
| 28.8 | 27.9 | 27.0 | 25.6 | 23.7 | 21.7 | 21.3 | 21.5 | 22.7 | 22.8 | 25.4 | 26.4 | 24.6 |
| 27.6 | 27.9 | 26.6 | 24.9 | 23.0 | 22.5 | 21.9 | 21.4 | 22.2 | 23.1 | 24.6 | 26.0 | 24.3 |
27. 7 7 |
27.6 | 27.9 | 26.5 | 24.9 | 22.9 | 22.3 | 21.9 | 22.8 | 23.7 | 25.4 | 26.5 | 25.0 |
| 27.5 | 27.0 | 26.8 | 25.7 | 23.8 | 22.2 | 21.8 | 21.9 | 22.7 | 24.6 | 25.4 | 26.8 | 24.7 |
| 27.8 | 27.9 | 26.3 | 25.1 | 23.4 | 21.5 | 21.5 | 22.1 | 23.3 | 24.2 | 26.0 | 26.6 | 24.6 |
| 27.3 | 27.3 | 27.3 | 26.2 | 23.9 | 22.1 | 20.8 | 21.6 | 22.5 | 23.2 | 25.0 | 26.5 | 24.5 |
27. 4 4 |
28.1 | 27.5 | 26.2 | 24.4 | 21.9 | 21.5 | 22.0 | 23.6 | 23.7 | 25.8 | 28.4 | 25.0 |
| 28.5 | 28.2 | 28.1 | 26.8 | 24.4 | 23.1 | 22.6 | 22.5 | 23.2 | 24.1 | 24.7 | 25.3 | 25.1 |
| 26.7 | 27.1 | 26.9 | 25.6 | 23.9 | 21.9 | 21.6 | 22.9 | 23.5 | 24.5 | 25.9 | 26.8 | 24.8 |
| 27.4 | 27.5 | 26.3 | 26.2 | 24.7 | 23.3 | 21.8 | 22.1 | 22.4 | 24.1 | 25.1 | 26.2 | 24.8 |
28. 4 4 |
28.0 | 27.9 | 26.4 | 23.7 | 21.9 | 21.3 | 21.7 | 23.4 | 23.9 | 25.6 | 25.8 | 24.8 |
| 27.2 | 27.9 | 27.7 | 26.5 | 25.0 | 23.1 | 21.9 | 21.9 | 22.4 | 24.4 | 26.0 | 27.4 | 25.1 |
| 28.0 | 27.8 | 27.2 | 26.6 | 24.7 | 23.0 | 22.6 | 22.0 | 22.8 | 24.2 | 25.1 | 27.2 | 25.1 |
| 27.9 | 27.4 | 26.9 | 25.8 | 23.9 | 22.2 | 21.8 | 21.9 | 22.5 | 23.5 | 25.9 | 26.7 | 24.7 |
27. 3 3 |
28.1 | 27.0 | 25.4 | 24.6 | 22.1 | 22.0 | 22.5 | 22.9 | 25.5 | 25.5 | 26.1 | 24.9 |
| 28.0 | 28.6 | 27.8 | 25.2 | 24.5 | 22.8 | 21.8 | 21.5 | 23.4 | 24.4 | 26.4 | 27.3 | 25.1 |
| 28.7 | 27.6 | 27.2 | 25.3 | 23.8 | 23.0 | 22.2 | 22.4 | 23.4 | 24.4 | 25.8 | 26.7 | 25.0 |
| 28.6 | 28.3 | 28.2 | 27.1 | 24.9 | 23.0 | 22.2 | 22.4 | 23.2 | 24.7 | 26.8 | 27.1 | 25.5 |
27. 5 5 |
28.0 | 28.0 | 26.2 | 23.5 | 22.6 | 21.9 | 22.4 | 23.2 | 23.7 | 26.2 | 27.3 | 25.0 |
| 27.8 | 28.6 | 27.8 | 27.2 | 24.3 | 23.3 | 22.2 | 22.2 | 23.4 | 23.9 | 25.5 | 26.9 | 25.3 |
| 27.8 | 28.2 | 27.2 | 25.9 | 24.4 | 22.4 | 22.4 | 22.7 | 23.5 | 25.0 | 26.8 | 27.3 | 25.3 |
| 27.2 | 27.5 | 27.9 | 26.1 | 24.1 | 22.5 | 22.1 | 23.3 | 23.2 | 24.3 | 25.6 | 27.3 | 25.1 |
27. 8 8 |
28.6 | 28.1 | 25.9 | 24.3 | 22.4 | 21.5 | 21.8 | 23.4 | 24.8 | 26.4 | 27.5 | 25.2 |
| 29.1 | 27.9 | 28.0 | 26.8 | 24.3 | 22.8 | 22.2 | 23.0 | 23.6 | 24.5 | 26.7 | 28.0 | 25.6 |
| 28.0 | 28.1 | 27.7 | 25.5 | 24.1 | 22.9 | 21.9 | 22.5 | 24.1 | 25.0 | 26.3 | 27.6 | 25.3 |
| 28.7 | 28.7 | 28.1 | 26.7 | 24.0 | 22.8 | 21.8 | 22.7 | 22.6 | 24.8 | 26.6 | 28.7 | 25.5 |
28. 2 2 |
28.6 | 28.1 | 26.3 | 24.4 | 23.0 | 21.7 | 22.0 | 23.5 | 24.7 | 26.6 | 28.0 | 25.4 |
| 27.8 | 27.9 | 26.6 | 24.4 | 23.8 | 21.9 | 22.3 | 22.3 | 22.5 | 25.1 | 25.9 | 27.8 | 24.9 |
| 28.5 | 28.7 | 27.2 | 25.2 | 23.9 | 22.7 | 21.9 | 21.9 | 23.4 | 24.6 | 25.9 | 27.4 | 25.1 |
| 28.3 | 28.8 | 28.5 | 27.1 | 25.4 | 23.2 | 22.6 | 22.2 | 23.2 | 25.5 | 26.9 | 27.5 | 25.8 |
28. 9 9 |
27.7 | 28.4 | 26.4 | 24.2 | 22.9 | 22.0 | 22.1 | 23.2 | 24.4 | 26.5 | 27.3 | 25.3 |
| 28.0 | 27.6 | 27.5 | 25.8 | 24.4 | 22.9 | 21.8 | 22.7 | 23.9 | 25.7 | 25.7 | 27.4 | 25.3 |
| 29.0 | 27.5 | 27.4 | 26.0 | 23.7 | 22.7 | 21.7 | 22.4 | 23.7 | 24.0 | 25.4 | 26.9 | 25.0 |
| 28.1 | 28.4 | 28.8 | 26.4 | 24.3 | 23.7 | 22.6 | 22.5 | 23.5 | 24.1 | 25.2 | 26.7 | 25.4 |
28. 2 2 |
28.1 | 27.3 | 26.3 | 24.7 | 23.4 | 22.5 | 22.0 | 23.5 | 25.5 | 26.1 | 27.6 | 25.4 |
| 28.1 | 28.6 | 28.3 | 26.8 | 23.9 | 22.6 | 22.5 | 22.3 | 23.7 | 25.0 | 26.4 | 27.5 | 25.5 |
| 28.7 | 28.6 | 28.0 | 26.5 | 24.8 | 23.9 | 22.9 | 22.8 | 23.3 | 24.9 | 25.3 | 27.0 | 25.6 |
| 27.3 | 28.0 | 28.2 | 26.8 | 25.0 | 23.4 | 22.8 | 23.2 | 24.0 | 24.2 | 25.2 | 27.2 | 25.4 |
28. 0 0 |
27.4 | 27.5 | 26.7 | 24.8 | 23.6 | 22.5 | 22.6 | 23.5 | 25.8 | 26.3 | 27.7 | 25.5 |
| 28.8 | 28.7 | 27.2 | 26.9 | 23.7 | 23.1 | 22.4 | 22.0 | 23.8 | 24.3 | 25.9 | 27.8 | 25.4 |
| 29.6 | 28.6 | 27.7 | 26.0 | 23.9 | 22.8 | 22.2 | 22.5 | 23.4 | 24.4 | 26.0 | 27.2 | 25.4 |
| 28.1 | 28.5 | 27.7 | 26.9 | 24.8 | 22.8 | 22.1 | 22.8 | 999.9 | 999.9 | 999.9 | 999.9 | 999.9 |
Location of the meteorological station on Europa Island:
latitude -22.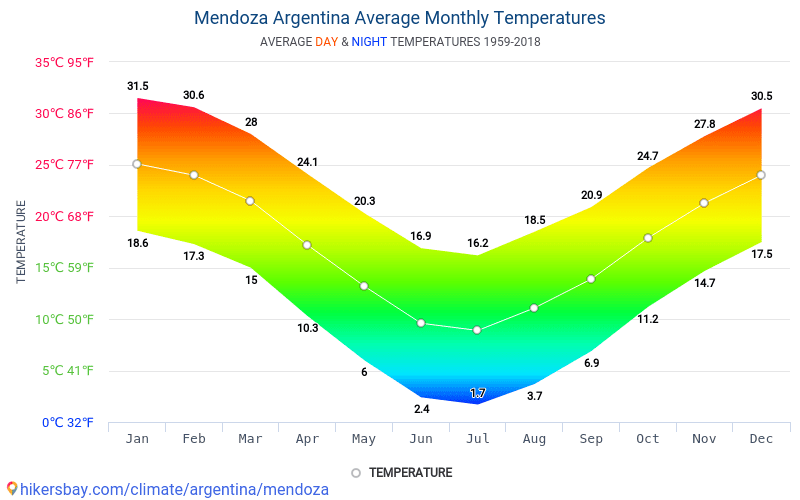 30 longitude 40.30 altitude 6 m.
Section navigation:
Average monthly and annual air temperatures on the Island of Europe
Monthly and annual totals of precipitation on the Island of Europe
Maximum daily totals of precipitation on the Island of Europe
“This is certainly October weather”: it will become sharply cold in Tatarstan
In early September, the temperature in the republic will be 6–7 degrees lower climate normal, weather forecasters predict
“For the time being, it is not worth counting on the fact that a good long Indian summer will come. In October, a large temperature drop is also observed in the Volga Federal District, and, as a rule, sleet often appears in the second half of the month. So far, there are prerequisites for this, ”said Elena Volosyuk, a leading specialist at the Phobos weather center. Nevertheless, if a cold snap covers Moscow tomorrow, then in Kazan on the Day of Knowledge “everything will be fine” – up to 25-30 degrees Celsius during the day. So far, weather forecasters are preparing for the “Arctic influx” until the middle of the month, but do not rule out “heat bursts”.
This summer has broken records for high temperatures. Abnormal temperatures were also in the Volga region. This is due to the fact that the focus of the anomaly is gradually receding to the east.
Photo: BUSINESS Online
“For 30 years the temperature has risen by a degree. This is an incredible speed.”2407 . The expert recalled that in 2021 the summer in Russia was also abnormally hot. However, the current season may beat last year’s record. “August has become the hottest month for Moscow. For the 144-year observation period, there has never been such a hot August. During the month, there were 8 days in the capital when the temperature exceeded the 30-degree mark. These data correspond to the average climatic temperature of Rostov,” the speaker emphasized.
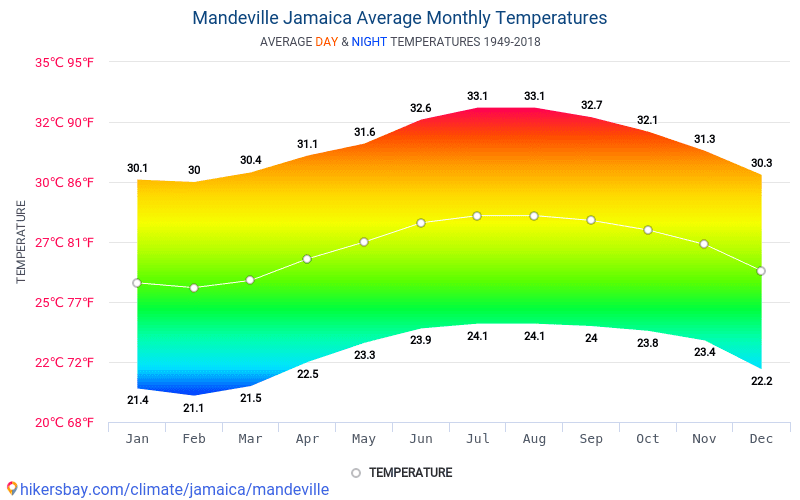 At the same time, the current August has become the driest for Russia. During the month, only 3 mm of precipitation fell in Moscow. A similar situation was observed in Europe. There, extreme heat, heatwaves, and a lack of rainfall have led to the shallowing of rivers.
Also, record temperature values were repeatedly broken this summer in the Pskov, Novgorod and Leningrad regions. In St. Petersburg, according to the speaker, the average monthly temperature exceeded the record figures of the year by 1.2 degrees.
Abnormal temperatures were also in the Volga region. This is due to the fact that the focus of the anomaly is gradually receding to the east. “Yesterday was record hot weather in the subjects of the Volga Federal District,” Vilfand said. In general, according to him, the weather in the Volga Federal District was changeable in the summer. “Heat was observed in the European territory of the country. But in fact, the border between hot and cool weather in Western Siberia was the zone of the Volga Federal District and the Urals. Therefore, in Kazan, Ufa and Yekaterinburg, the temperature background was only 1 degree or even half a degree above the norm, but in general it was quite close to it, ”he answered a question from a BUSINESS Online correspondent.
On July 1, the Russian Federal Service for Hydrometeorology and Environmental Monitoring switched to new standards, the expert specified. Where previously the 1961-1990 normals were used, the 1991-2020 values will now be the norm. “For 30 years, the temperature has risen by a degree, this is an incredible speed. During the life of the Earth, there has never been such a rate of warming,” Vilfand emphasized. At the same time, the expert urged not to associate global warming with a monotonous increase in temperatures. Each subsequent year will not necessarily be hotter than the previous one, but with each new decade, temperatures should be expected to increase.
The Volga region will be much more lucky with the weather on Knowledge Day. In Kazan it will be plus 16-17 degrees in the morning and 25-30 degrees above zero in the afternoon
Kazan, according to weather forecasts, will be lucky with the weather on September 1
After abnormal heat, residents of a number of central regions of Russia will immediately have to face deep autumn. In Moscow, a sharp drop in temperature by 15 degrees or more is expected. This is due to the fact that the local anticyclone, which caused the removal of warm air masses from the southeast, will change the circulation. If today air masses go to Russia from the West and the Baltic states, then tomorrow they will become northern. In forecasts for the first days of September, they will often talk about the southwest wind, but this statement does not quite reflect the essence. “The southwest wind is coming, which is genetically northerly. Therefore, a significant drop in temperature is expected in the capital. Tomorrow the temperature in Moscow will be in the range of 12-14 degrees.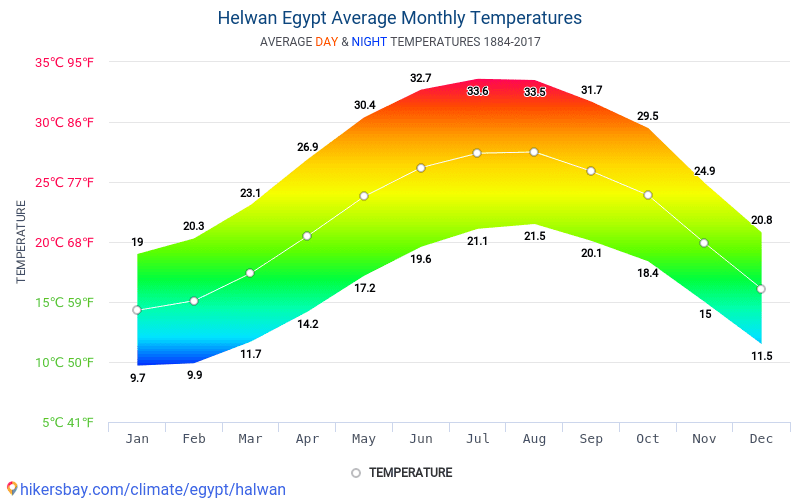 It is also important to note that wind gusts will reach 15 meters per second,” Vilfand said. He added that after September 1, one should not expect warming. The movement of the anticyclone will lead to the fact that from September 3 at night in the capital it is possible to drop the temperature to 1 degree Celsius. In Omsk, Tomsk, Novosibirsk, Kemerovo regions, the temperature will be set slightly above the norm. In the northwestern district, the temperature background is predicted to be below normal. A noticeable drop in temperature is expected in Crimea and Stavropol. The maximum temperatures so far are predicted to be in the normal range of 22-25 degrees.
The Volga region will have much better luck with the weather on Knowledge Day. “Everything will be fine in Ufa and Kazan — plus 16-17 degrees in the morning and 25-30 degrees above zero in the afternoon. It is also comfortable in Samara. It is from 17 to 29 degrees there,” the speaker noted.
Giving a general assessment of the September weather, Vilfand said that until the end of the first ten days of September the temperature would be colder than normal. However, this is not a detailed forecast. According to the speaker, weather forecasters today are not able to provide accurate data for a month ahead.
On Thursday, September 1, a thunderstorm is expected in some places in Tatarstan with short-term intensification of the southwest wind up to 15-20 m / s, the hydrometeorological center of the republic warned
It will get colder at the end of the week, but there will still be “bursts of heat”
All August weather in Tatarstan was formed by anticyclones, the month will be remembered as abnormally dry and hot, the hydrometeorological center of the Republic of Tatarstan told BUSINESS Online. They noted that on the morning of August 31, the average monthly temperatures were 3-5 degrees above normal. “Precipitation for the month in some places fell from 0.3 to 8 millimeters. August of this year in Tatarstan turned out to be the driest month in the history of meteorological observations. It will also become one of the hottest in history,” the hydrometeorological center said. They specified that the upcoming cooling in the Republic of Tatarstan and on the European territory of Russia will cause the passage of an active northwestern cyclone, which will bring cold air from the northern latitudes.
On Thursday, September 1, a thunderstorm is expected in some places in Tatarstan with short-term intensification of the southwest wind up to 15–20 m/s, the hydrometeorological center of the republic warned. According to the forecast of the department, next night the temperature will drop to 14-19 degrees, and in the daytime it will warm up to 21-27 degrees, in the east – up to plus 30 degrees. And then – a sharp cold snap. According to the preliminary forecast, on September 2, the temperature will drop to 10–15 degrees at night, and will not exceed 17–22 degrees during the day. Temperatures will continue to drop over the weekend. On Saturday and Sunday, September 3 and 4, it is expected to drop to 3-8 degrees, in the afternoon it will not be higher than 14-19. However, there is little chance of rainfall. The cold weather will continue into the beginning of next week, with light rain in places. At the same time, weather forecasters emphasized that due to the lack of effective precipitation (part of the precipitation that remains in the soil), the extreme fire danger of forests remains until September 6.
“It’s definitely October weather, not even September, it’s the beginning of October,” commented the expected drop in temperature in a conversation with a BUSINESS Online correspondent, a professor at the Department of Meteorology, Climatology and Atmospheric Ecology of the Institute of Ecology and Nature Management KFU Yuri Perevedentsev . According to him, the air temperature that awaits us in early September will be 6-7 degrees below the climatic norm. According to long-term calculations, the average daily temperature on September 1 should be about plus 16 degrees, but in reality it will be on average plus 10 degrees, the source of the newspaper noted. “This kind of Arctic influx will last for some time, but it cannot be that the temperature does not return to normal,” the professor hopes. “Usually, such episodes happen within a week, because there will be a certain warming up of this air mass, the earth still warmed up quite a lot over the summer.” Thus, a slight, but warming in September is still possible, the specialist reassured.
The upcoming cooling in Tatarstan will be quite long, and at least until the middle of the month the temperature regime will significantly lag behind the norm by an average of 2-3 degrees, Elena Volosyuk, a leading specialist of the Fobos weather center , , said in a conversation with BUSINESS Online. . “That is, the temperature will be more typical for the end of September – the beginning of October than for the first half of September. At the same time, in the second decade of the month, there will be more rains, and this will have a beneficial effect on the moisture content of the soil, and in the Volga Federal District and Tatarstan, as in many regions of the European part of Russia, there is still a significant soil drought. But we are waiting for rains due to the fact that, in principle, the activity of cyclones over the European part of the country is activated, so that they will carry Atlantic air saturated with moisture,” Volosyuk said.
If we talk about September as a whole, the temperature will be close to the average multi-year values or even lower, but on some days “heat bursts” are possible – up to 20 degrees and above. “For now, it’s not worth counting on the fact that a good long Indian summer will come. In October, a large temperature drop is also observed in the Volga Federal District, and, as a rule, sleet often appears in the second half of the month. So far, there are prerequisites for this,” the speaker added.
Subtropical climate zone
Subtropical climate zone
Igor Kibalchich
Synoptic
© pixabay. com
com
In today’s publication we will tell you about the subtropical climate, which is typical for many countries in Southern Europe, where we are used to relaxing and spending holidays. The weather conditions in this climate are quite diverse. There are heavy rains, unbearable heat, tornadoes, and even snow with short-term frosts.
The subtropical belt is transitional, according to the classification according to B. Alisov. It is located in the area approximately between 30 and 40 degrees latitude in the southern and northern hemispheres of our planet. The climate here is formed under the influence of seasonal changes in air masses: tropical air in summer, which is formed in the belt itself under the influence of high insolation (the amount of incoming solar energy), and moderate air in winter, coming from higher temperate latitudes. According to generally accepted estimates by climatologists, the climate of the area is considered subtropical if the average annual temperature is above +14 ° C, and the average temperature of the coldest month (January or July, sometimes February or August, depending on the hemisphere) is below this mark, but exceeds 0 ° C.
The subtropical climatic zone has spread quite widely across the globe (see map). It covers the Mediterranean region, most of the United States, the interior of Asia, eastern China, the southern regions of Australia, Africa, Patagonia in South America, and the coast of Chile in the south. And even the residents of Ukraine have the opportunity to feel its benefits without leaving the Motherland – this is the Southern Coast of Crimea, and in recent years, signs of subtropics due to global warming have also appeared in the south of the Odessa region and in Transcarpathia.
Weather in Ukraine for tomorrow
30 September 14:06
Due to the different features of the geographical location, relief, as well as the distribution of land and sea, several subtypes are distinguished in this belt. We will briefly describe their main characteristics below.
1. Continental subtropical climate – arid, with hot (average temperatures around +30 °С, and maximum temperatures can reach +45…+50 °С) dry summer and cool (0. .. +5 °С), relatively wet (200 – 250 mm precipitation) in winter, with unstable weather. The daily and annual temperature amplitudes are significant. Humidification is insufficient, therefore natural zones of deserts, semi-deserts, and dry steppes predominate. In Eurasia, this climate is developed in the center of the continent, far from the oceans, especially in the basins. In North America, it formed mainly on the Colorado Plateau. This climate is characterized by dust storms.
2. The climate of the western coasts of the continents is called Mediterranean because it is most typical for the Mediterranean coast (Southern Europe, Western Asia, North Africa), although there are territories with such a climate on other continents. It is characterized by relatively hot (average temperatures over +20 °C) dry summers with anticyclonic weather, mild (about +10 °C) wet (300 – 800 mm of precipitation) winters with cyclonic activity and unstable weather. Waterspouts often form over the seas. The predominant vegetation is drought-resistant evergreen hardwood forests and shrubs. Currently, vineyards, plantations of citrus, kiwi, dates and other subtropical crops are actively cultivated.
3. The climate of the eastern coasts of the continents is monsoonal , it is most pronounced in Eurasia. In summer, a steady monsoon from the ocean prevails here – sea tropical air, relatively hot, with average temperatures of + 23 … 25 ° C, a sufficient amount of precipitation. Tropical cyclones with gusty winds and heavy rainfall are frequent in late summer and early autumn. Winter is relatively cool (on average 0…+5 °С, but in some places below 0 °С) and relatively dry, since the monsoon from land from seasonal centers of atmospheric action, in particular from the Asian anticyclone, brings continental air mass. But near the coasts and on the islands, frontal precipitation falls in winter. The total amount of precipitation reaches about 1000 mm. Humidification is sufficient. Vegetation – variable-humid deciduous broad-leaved and mixed forests. High degree of agricultural development.
4. The oceanic climate resembles the Mediterranean climate in terms of precipitation – relatively dry summers, wet winters with frontal precipitation. The temperature in summer is about +20 °С, in winter +15 °С.
The most striking examples of different types of subtropical climate are presented on climatograms (which show average monthly temperatures and rainfall). Cities are randomly selected from different regions of the planet.
The subtropical belt as a whole is characterized by predominantly positive (according to long-term data) temperatures throughout the year. However, in winter, short-term drops in temperature to negative values are possible here, snowfalls are not uncommon, especially in the monsoon climate and in mountainous areas. On the plains, it melts quickly, in the mountains it can persist for up to several months. The exception is the largest and highest (4-5 km) highlands of the world, Tibet, located in this belt. It is characterized by a special kind of sharply continental climate: cool summers, severe winters, and little rainfall. Alpine deserts are developed on the highlands. Hurricanes often occur off the southern and southeastern coast of the United States due to the flow of the warm Gulf Stream. Tropical cyclones can also reach northern New Zealand.
Another distinguishing feature of the subtropical climate in the United States is the abundance of tornadoes. Here is the famous Tornado Alley. Due to the peculiarities of the geographical location, convective processes and thunderstorms are especially powerful here throughout the year. Another alley of tornadoes is concentrated in South America in Argentina, Paraguay and Uruguay. Tornadoes are also frequent in this area, including destructive ones.
Prepared by Igor Kibalchich, candidate of geographical sciences, forecaster.
- Today
- Tomorrow
- Monday
- Tuesday
+20 °
Vinnitsa
+15 °
Lutsk
+24 °
Dnepr
+25 °
Donetsk
+15 °
0013
+25 °
Zaporozhye
+21 °
Ivano-Frankivsk
+17 °
Kyiv
+22 °
Kropivnitsky
+23 °
Sevastopol
+22 ° C. Sevastopol
+22 ° C. Sevastopol
+25 °
Lugansk
+14 °
Lviv
+24 °
Nikolaev
+24 °
Odessa
Poltava
+19°
Sumy
+15 °
Ternopol
+21 °
Kharkov
+24 °
Kherson
+16 °
+20 °
+20 ° 9 °
+20 ° 9 ° 9 °
Chernihiv
+24°
Chernivtsi
+13°. ..+19°
Vinnytsia
+9°…+12°
Vinnytsia
+8°…+10°
Vinnytsia
+10°…+14°
Lutsk
+9°…+11°
Lutsk
+8°…+12°
Lutsk
+18°…+22°
Dnepr
+11°…+16°
Dnepr
+9° …+18°
Dnipro
+16°…+24°
Donetsk
+10°…+20°
Donetsk
+10°…+18°
Donetsk
+12°…+15°
Zhytomyr
+9°…+12°
Zhytomyr
+7°…+10°
Zhytomyr
+11°. .+17°
Uzhhorod
+9°…+14°
Uzhhorod
+9°…+14°
Uzhhorod
+17°…+23°
Zaporozhye
+11°… +16°
Zaporizhia
+11°…+19°
Zaporizhia
+11°…+17°
Ivano-Frankivsk
+8°…+14° Ivano
-Frankivsk
+8°…+13°
Ivano-Frankivsk
+13°…+16°
Kyiv
+9°…+12°
Kyiv
+7 °…+11°
Kyiv
+16°. ..+21°
Kropyvnytsky
+10°…+16°
Kropyvnytsky
+9°…+14°
Kropyvnytsky
+39 …+23°
Sevastopol
+12°…+19°
Sevastopol
+12°…+20°
Sevastopol
+16°…+22°
Simferopol
+11°…+18°
Simferopol
+11°…+19°
Simferopol
+16°…+25°
Lugansk
+12°…+22°
Lugansk
+11°…+20°
Lugansk
+9°…+14°
Lviv
+8°. ..+11°
Lviv
+7°…+11°
Lviv
+19°…+22°
Nikolaev
+10°…+19°
Nikolaev
+11°…+18°
Nikolaev
+19°…+23°
Odessa
+11°…+19°
Odessa
+10°… +18°
Odessa
+14°…+18°
Poltava
+9°…+15°
Poltava
+7°…+14°
Poltava
+10°… +14°
Exactly
+9°…+11°
Exactly
+7°. ..+11°
Exactly
+13°…+19°
Sumy
+7°…+14°
Sumy
+9°…+13°
Sumy
+10°…+15°
Ternopil
+8°…+11 °
Ternopil
+7°…+11°
Ternopil
+15°…+21°
Kharkiv
+10°…+15°
Kharkiv
+8°…+16°
Kharkiv
8°012 …+22°
Kherson
+10°…+18°
Kherson
+10°…+19°
Kherson
+11°…+16°
Khmelnytsky
+9°…+11°
Khmelnytsky
+8°…+11°
Khmelnytsky
+16°…+19°
Cherkasy
+10°. .+15°
Cherkasy
+9°…+14°
Cherkasy
+12°…+15°
Chernigov
+7°…+11°
Chernihiv
+ 6° …+10°
Chernivtsi
+12°…+20°
Chernivtsi
+9°…+16°
Chernivtsi
+8°…+14°
Chernivtsi
Previous news
22 February 13:34
Next news
22 February 15:18
-
Igor Kibalchich
SynopticWeather forecast in Ukraine for October 2022
Weather in Ukraine for tomorrow
29 September 10:18 -
Igor Kibalchich
SynopticOverview of weather conditions in Ukraine for the week: September 26 – October 2, 2022
Weather in Ukraine for tomorrow
25 September 14:52 -
Igor Kibalchich
SynopticWeather forecast in Ukraine for the weekend: 24 – 25 September 2022
Weather in Ukraine for tomorrow
23 September 13:21 -
Igor Kibalchich
SynopticA powerful tornado caused trouble in the Sumy region
Weather elements and disasters
19 September 13:06
 meteoprog.net/thumbnails/newsweather/cropr_518x337/big_611542.jpg?1664535960″>
Weather forecast in Ukraine for the weekend: 1 – 2 October 2022
Igor Kibalchich
Synoptic
Weather in Ukraine for tomorrow
30 September 14:06
Interesting weather facts
1 October 14:06
Interesting weather facts
1 October 12:52
Weather signs
1 October 10:18
-
Powerful hurricane Ian hits Florida
-
Hurricane Yan intensifies as it approaches Florida and Cuba
-
VIDEO.
Powerful Hurricane Fiona hits Canada
 Powerful Hurricane Fiona hits Canada
Weather in other regions
Kyiv
+17°
Kharkiv
+21°
Odessa
+24°
Dnipro
+24°
Donetsk
+25°
Zaporozhye
+25°
Lviv
+14°
Krivoy Rog
+24°
Nikolaev
+24°
Mariupol
+23°
Lugansk
+25°
Vinnitsa
+20°
Kherson
+24°
Chernihiv
+16°
Poltava
+20°
Cherkasy
+20°
Khmelnitsky
+16°
Chernivtsi
+24°
Zhitomir
+15°
Sumy
+19°
All cities
OLD VERSIONMOBILE VERSION
© Meteoprog. ua 2003-2022
KFU professor spoke about the weather for the holidays
May 1, 2022 13:00
Natalia Rybakova
During the May holidays, the weather in the capital of Tatarstan will be determined by the anticyclone, the center of which is located in Western Europe over England. Yuri Perevedentsev, professor of Kazan Federal University, doctor of geographical sciences, told the correspondent of Tatar-inform about the changeability of the weather, possible rains, hail and thunderstorms.
“In the next ten days the temperature will be 3-5 degrees below normal”
According to the scientist, in early May, average daily temperatures are significantly behind the climatic norm.
Precipitation in early May is expected to be negligible. This is a dry and cool period, with polar air intrusions
Photo: © Vladimir Vasiliev / Tatar-inform
“On the first of May, the average daily temperature should be 10-11 degrees, but in fact it will be at the level of 5 degrees. The day will be sunny, no precipitation is expected, a northerly wind is possible. In the next decade, temperatures are expected to be 3-5 degrees below the climatic norm, it will be cool,” Yuri Perevedentsev said.
According to the scientist, the entire European part of Russia will be shrouded in cold. Precipitation in early May is expected to be negligible. This is a dry and cool period with polar air intrusions. However, by the end of the month it will become noticeably warmer.
“The average monthly temperature in May in Kazan is usually 13 degrees Celsius, and precipitation falls at the level of 40 mm. According to the preliminary forecast of the Hydrometeorological Service of the Russian Federation, precipitation and average monthly temperatures this month in our city will be within the normal range,” said the KFU professor.
Throughout the month, temperature fluctuations are possible in the capital of Tatarstan. In the spring there is a lot of sun, so the air warms up significantly during the day.
Yuri Perevedentsev: “Last year summer in Kazan started on May 9th. This year, on Victory Day, there will definitely not be such a transition”
Photo: © Salavat Kamaletdinov / Tatar-inform
“The weather will be comfortable for the start of the summer season”
Meteorologists believe that summer comes when there is a steady transition of average daily temperatures through the 15-degree mark. According to climatic standards, this usually happens in our area in the third decade of May, but there are exceptions.
“Last year summer in Kazan started on May 9th. This year, there will definitely not be such a transition on Victory Day, unlike last year, we do not have to expect high average daily temperatures in early May. But a 30-degree heat by the end of May may well be, we can’t renounce this, ”Yuri Perevedentsev believes.
The interlocutor of “Tatar-inform” noted that in early May in Kazan, the diurnal cycle is well expressed: the nights are quite cool, frosts are possible in the lowlands.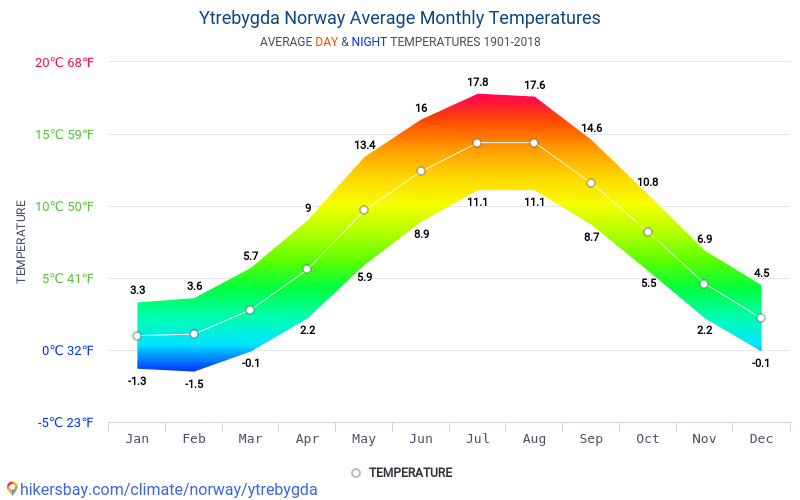
“But overall it’s not bad. People say: cold May is a fertile year, now the heat is not needed, ”the scientist noted.
The weather for the May holidays will generally be comfortable for the beginning of the summer season, because there will be no excruciating heat and rains
Photo: © Ramil Gali / Tatar-inform
According to him, the weather for the May holidays will generally be comfortable for the start of the summer season, because there will be no excruciating heat and rain.
“Four monthly rainfall fell on Kazan”
What do residents of the city remember about April? It turns out that this month the capital of Tatarstan was hit by four monthly rainfall norms at once.
“According to the KFU weather station, 115 mm of precipitation hit Kazan in April, which is almost four monthly norms. Normally, 30 mm of precipitation should have fallen in a month. I don’t remember such a thing in the whole history,” said the KFU professor.
“According to the KFU weather station, 115 mm of precipitation fell on Kazan in April, which is almost four monthly norms”
Photo: © Ramil Gali / Tatar-inform
On the night of April 27-28 and in the morning, 16 mm of precipitation fell in the capital of Tatarstan, which is half of the monthly norm. Abundant precipitation Perevedentsev explained cyclonic activity. In the second spring month, cyclones constantly came to Kazan from the south, from the Mediterranean and Black Seas. The first month of spring, on the contrary, turned out to be very dry. Anticyclones prevailed in March, with only 4 mm of precipitation falling during the month. Also, the outgoing April was remembered by the inhabitants of Kazan with thunderstorms, which are usually uncharacteristic for this period.
“Thunderstorms occur during atmospheric fronts, when large temperature drops occur. On April 27 in the afternoon in Kazan it was 20 degrees, and on April 28 – 9 degrees. The warm air was replaced by cold, polar air,” Yuri Perevedentsev explained.
“Summer cataclysms, thunderstorms, squalls, showers are possible”
Summer is just around the corner, what kind of weather will it please Tatarstan residents? According to the preliminary forecast, the summer in our lane will not be hot.
“According to the long-term forecast of Hydromet of the Russian Federation, July will be cool, temperatures are expected to be below the climatic norm. September will be hot, temperatures are expected to be above the climatic norm. June and August are expected to be within the climatic norm,” said the KFU professor.
“In summer, with the arrival of a cold front, various cataclysms, thunderstorms, squalls, and showers are possible. There are more dangerous weather events in summer than in winter.
Photo: © Mikhail Zakharov / Tatar-inform
In June, the average monthly temperature in Kazan is expected to be within the climatic norm, which is slightly above 17 degrees. Precipitation is predicted at the level of 60-68 mm, thunderstorms and showers are possible. July in our region is expected to be cold, the temperature is expected to be below the climatic norm, which is just over 20 degrees.
“In summer, with the arrival of a cold front, various cataclysms, thunderstorms, squalls, and showers are possible. In summer, there are more dangerous weather events than in winter, as a strong confection occurs,” Perevedentsev warned.
The temperature in August is expected to be within the normal range and will be about 17 degrees. Precipitation for the month will fall at the level of 60 mm. But in September the temperature will be above the climatic norm, but there may be a shortage of precipitation. In September, the average monthly temperature in Kazan is normally about 11 degrees, precipitation falls at the level of 50 mm.
Finally, the speaker of KFU noted that now you shouldn’t get upset. Long-term forecasts are usually justified by 60-70%. Perhaps the forecast for July will still be adjusted and the summer will be hot.
Announcement photo: © Mikhail Zakharov / Tatar-inform
Primorye climate features
28.
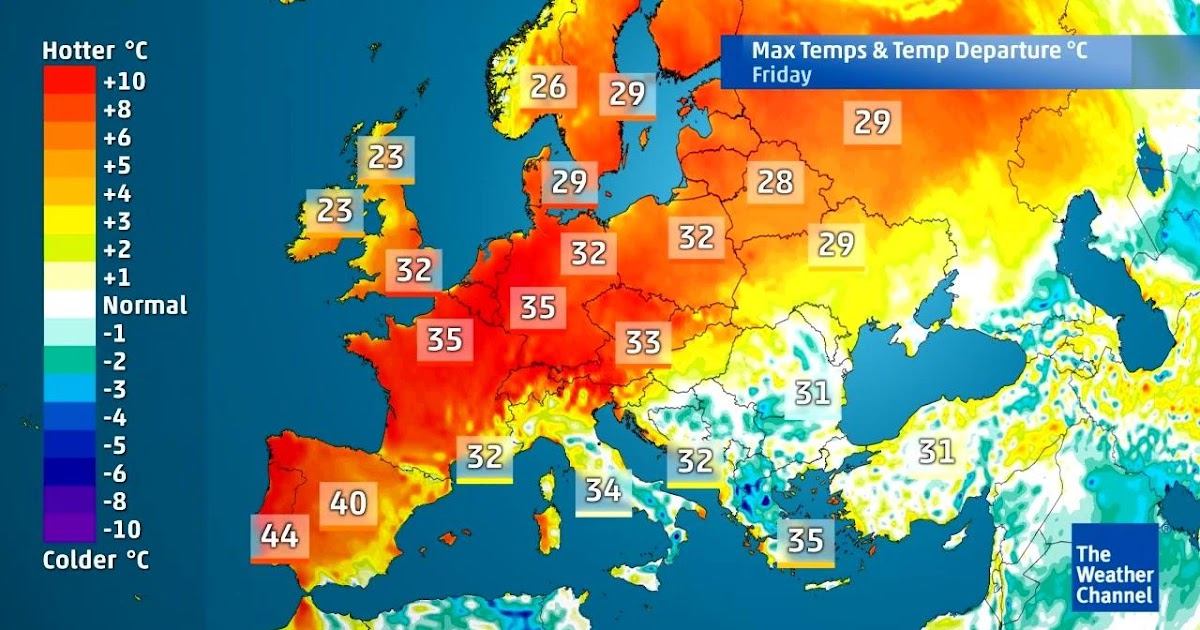 05.2002 17:00
Primorsky Krai is located on the southeastern outskirts of Russia, on the coast of the Sea of Japan. About 4/5 of the territory of the region is occupied by the Sikhote-Alin mountain system stretching from the northeast to the southwest, leaving only a fifth of Primorye to the plains and lowlands.
Being on the border of the world’s largest continent and the largest of the oceans, Primorsky Krai is constantly under the influence of these two giants. Of decisive importance is not so much the location of edge in rather low latitudes of the temperate zone as its position on the edge of the vast Asian continent, which cools strongly in winter and warms up in summer.
Monsoons dictate the weather in Primorye . In winter, the territory of the region is under the predominant influence of very cold and dry air masses that form in the area of a powerful Asian anticyclone. The resulting air flow is directed from the regions of China to the southeast, from the region of the Asian anticyclone to the region of lower pressure, located over the Pacific Ocean and marginal seas.
At summer time the movement of air masses acquires the opposite direction. At this time, southeasterly winds bring relatively cool and humid sea air in the first half of summer and very humid and warm air in the second half.
Winter in Primorye
Spring in Primorye
Summer in Primorye
Autumn in Primorye (September, October, November)
Winter
2406 precipitation deficit , and in terms of temperature regime close to long-term values or above them. Cold winters (monthly averages below the norm by 2-3°C) are quite rare.
Average monthly air temperatures in range from 13-18°C (in February in places on the coast 7-12°C) to 20-25°C. The most low average monthly air temperatures in winter are observed in the continental regions of the region – on the western slopes and in the Sikhote-Alin mountains. The decisive role in the distribution of winter temperatures in the region belongs to the Sikhote-Alin ridge, which is a natural climatic boundary between the eastern coastal and western foothill regions.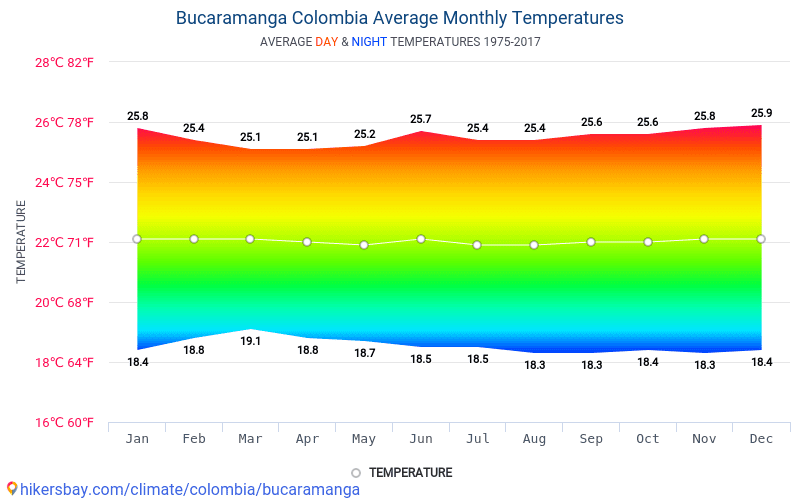 The increase in winter temperatures on the coast of the Sea of Japan is explained not only by the screening role of the Sikhote-Alin in relation to monsoon flows and the warming effect of the sea, but also by the presence of “foehn” processes here; winds blowing from the Sikhote-Alin mountains towards the sea on some days significantly increase the air temperature, and therefore in winter the warmest areas are the southern and eastern coasts of the region.
The duration of the cold period (with average daily air temperatures below 0°C) in most of the territory of the region is 130 – 160 days, and only in the northern part of the western foothills and on the peaks of the Sikhote-Alin it increases to 180 days. The lowest night temperatures (absolute minimum) are 40 – 45°С in the north of the region 47 – 49°С, in coastal areas 26 – 31°С.
A feature of the coastal climate in the cold half of the year is the presence of frequent thaws . In some, the warmest years , the maximum air temperature (absolute maximum) can rise up to 7 – 12°C, in February – up to 14 – 16°C. Monthly precipitation totals (norm) in the winter months are the smallest in their annual distribution. The value ranges from 5 mm (in the western regions of the region) to 29 mm (in the central regions). In some years, the monthly amount of precipitation can significantly exceed the norm and amount to 20 – 64 mm. In the south of the region, there are frequent cases when precipitation falls below the norm.
The heaviest snowfalls (20 mm and more, in 12 hours or less) are more often observed in the east of the region, almost annually. The recurrence of strong blizzards, ice-frost deposits occurs once every ten years.
In the cold half-year, when there is always a large difference between the atmospheric pressure over the Asian continent and the Pacific Ocean, the frequency of stormy northern winds increases : in some years, the number of days with a wind of more than 15 m/s in the region can reach 15 – 20.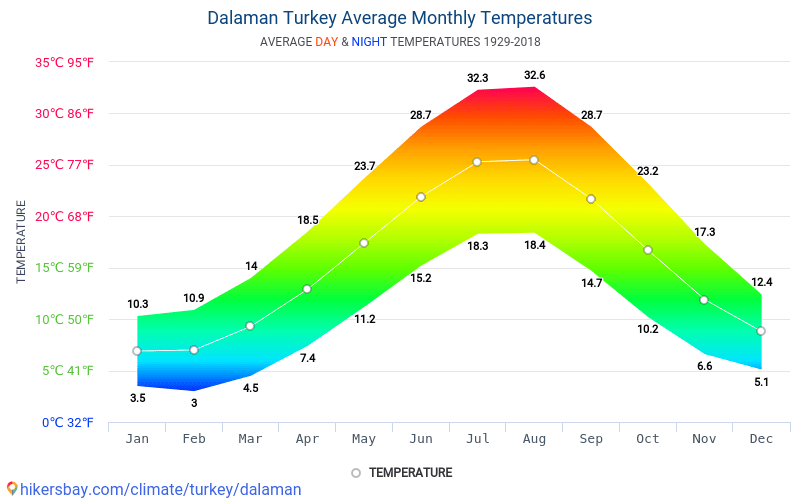
Spring
Spring is protracted in the region. In continental regions, the air temperature rises from 0 to 10°C in spring in 30-45 days, on the coast of the Sea of Japan and in coastal areas this period increases to 50-70 days.
Frosts stop first of all in the southern and coastal regions in the third decade of April, in the rest of the region – at the end of April and in the first decade of May, but frosts are possible in the east of the region and in early June.
A continuous increase in heat inflow in March leads to a sharp increase in air temperature from day to day. Despite the fact that the average monthly air temperature this month throughout the region has negative values, it is higher than in February by an average of 5 – 10 ° C and is 4 – 9 ° C, on the coast – 1 – 3 ° C frost. In subsequent spring months, there is a noticeable increase in the average monthly air temperature. If in April it is 1 – 6°C of heat, then in May it is 7 – 12°C.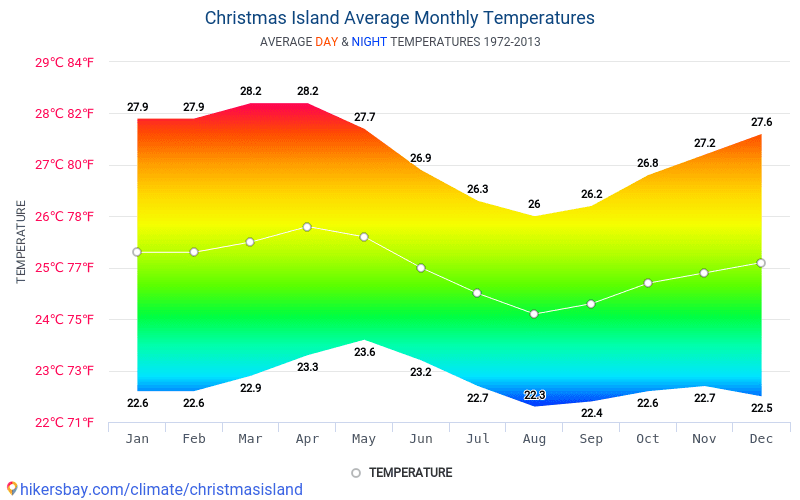
The value of the absolute minimum air temperature, i.e. temperature possible only on some nights of the coldest years varies from 20-25°С (in the mountains 32-37°С frost) in March to 4-9°С frost, in the south 0-2°С heat in May. The highest values ( absolute maximum ) are in March – 16 – 21°С, in April – 25 – 30°С and in May – 30 – 35 °С. In the first half of April, the snow cover melts. Precipitation in spring compared to winter increases to 30 – 60 mm, in May at some weather stations up to 70 – 94 mm. In some years, dry periods are observed, when the monthly amount of precipitation does not exceed half of the average long-term norm. So, in 1989, 1993, 1997, 1998. precipitation in most of the continental regions amounted to only 20 – 50% of the long-term norm.
In spring, the number of fogs increases from 1-3 days in continental areas to 11-13 days on the coast. In March, the winter monsoon continues to operate on the territory of the region, but already in a number of regions of the region, a decrease in the frequency of the main winter directions is noticeable, and winds with directions characteristic of the warm period of the year appear, by May the frequency of strong winds of these directions increases noticeably.
Summer
Summer in Primorye in its first half is usually hot and dry in the continental part and cool with frequent fogs and drizzle – on the coast and in the second half – hot, humid, with heavy rains.
The average monthly air temperature on the coast of the Sea of Japan in June is 3-5°C higher than in May. On the eastern slopes of the Sikhote-Alin and the entire coast of the Sea of Japan, it is 9-15°C. As the distance from the coastline deep into the territory, the temperature increases markedly, and the highest values of the average monthly temperature are observed in the valley of the Arsenyevka River and the middle reaches of the Ussuri River – 16-18°C.
The variability of the average monthly air temperature from year to year is insignificant. In the first ten days of June, in the eastern regions, the cessation of the last frosts is noted. On the coldest nights of June, the air temperature drops to 0-3°C in the plains and in the south of the region to 5-7°C. Value absolute maximum is 34-36°C, in coastal areas 27-30°C. The amount of atmospheric precipitation by June increases and their distribution across the territory is uneven: the smallest in the Khanka Plain, the largest in the basin of the Bikin, Bolshaya Ussurka, Malinovka rivers, in the middle reaches of the Ussuri River.
The wind regime of is weakened this month, only with the intrusion of cold air masses of the Sea of Okhotsk, an increase in the northeast wind along the Primorsky coast is noted.
The summer monsoon in July-August becomes the most stable. For continental regions, July, and for coastal regions, August are the warmest months of the year. Average monthly air temperatures are high and amount to 16-21°С. The value of the absolute maximum reaches 35-40°С, on the coast 31-34°С.
Of the dangerous hydrometeorological phenomena in these summer months, very heavy rain (precipitation of 50 mm or more, in 12 hours or less) and prolonged heavy rains with precipitation of 100-120 mm or more in 2-3 days are noted.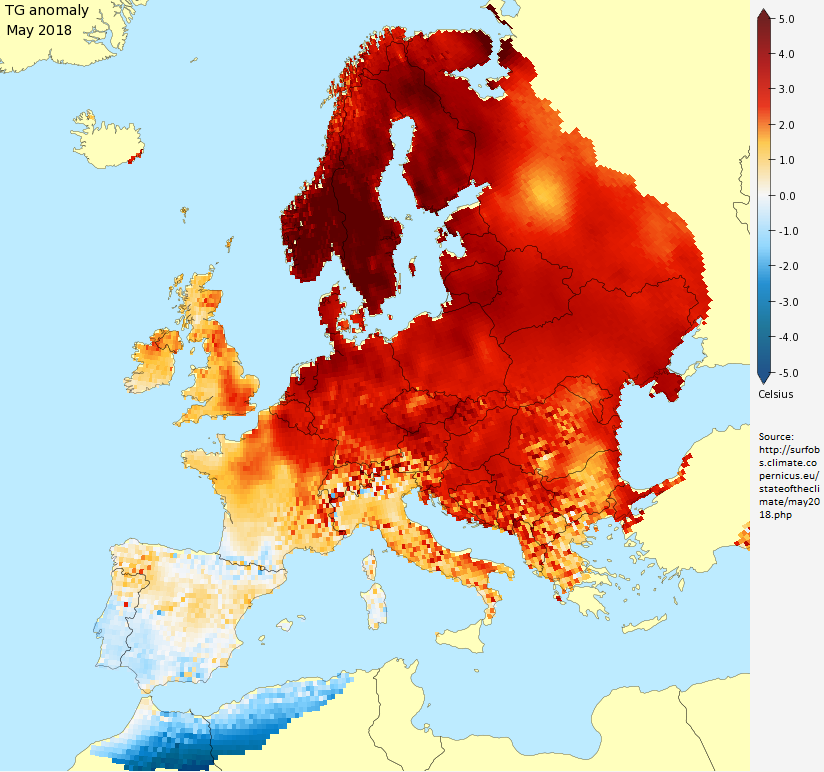
The air temperature in summer rises from the coastal strip inland, and its highest values are observed on the Khanka Plain (20-22). On the western slopes of the Sikhote-Alin, its values are 3–3.5°C higher than on the eastern slopes and on the coast of the Sea of Japan. The territory of the region belongs to the zone of sufficient moisture: about 80-92% of precipitation occurs in the warm period of the year, with the bulk of heavy and heavy rainfall falling in the second half of summer.
Heavy rains are usually associated with the passage of typhoons and southern cyclones over areas of Primorsky Krai. The value of the maximum daily precipitation changes to 90 – 100 mm in intermountain valleys, in the south – up to 260 mm. In Vladivostok – up to 244 mm (1990). Summer precipitation is often accompanied by thunderstorms.
Areas of increased thunderstorm activity are the Khanka plain and the northern foothills of the Sikhote-Alin, where the average number of days with a thunderstorm is 2-3.
Autumn
The air temperature from August to September decreases in continental regions by 6-7°C, and on the coast of the Sea of Japan by 2-4°C. The average monthly air temperature is 11-16°C. The air temperature at night is positive, and most often ranges from 14-19°С, (in some years at the beginning of the month 20-21°С) up to 2-7 °С heat. The first frosts are possible in the region in September (until September 20 they are classified as dangerous phenomena).
In the upper reaches and in the middle parts of the valley of the western foothills of the Sikhote-Alin, in the upper reaches of the valleys of the eastern foothills, on average, frosts are observed in the third decade of September. The air temperature during the day in September is quite high 19-24°C, in some years 26-31°C. The amount of precipitation in September compared to August decreases and amounts to 80-140 mm, the least precipitation was in 1988, 1991, 1997. In some years, precipitation may exceed the norm by 2-2.5 times or more. Especially a lot of precipitation was in 1989, 1992, 1994.
Downpours are observed in the region when more than 30 mm of precipitation falls in one hour. The number of days also decreases with thunderstorms (up to 1-3 per month) and fogs (up to 1-6). The average monthly air temperature from September to October decreases everywhere by 6-8 °С, and in the north of the central regions by 8.5-9 °С and is 2-7 °С, in the south – up to 9°C.
In the flat part of the territory of the region, at the beginning of the first decade, the first frosts can be observed. In the basin of the Bikin, Bolshaya Ussurka, Malinovka, Samarka rivers, as well as in the upper reaches of the Zhuravlevka and Ussuri rivers and on the mountain peaks of the Sikhote-Alin, in the third decade of October, the average daily air temperature passes through 0 ° C . The average minimum air temperature in most of the territory of the region is positive.
The lowest average minimum air temperatures are observed in the foothills and mountainous areas of the Sikhote-Alin down to 2-4 °C below zero. In the daytime, the air in October warms up to 10-15°C. On some days of the warmest years, during the day the air heated up to 25-28°C.
The highest temperatures are observed in Posiet Bay in October: here the absolute maximum reaches 29-31°C. In the rest of the region, the absolute maximum air temperature ranges from 23 to 25°C, in the Sikhote-Alin mountains from 17 to 18°C. Atmospheric precipitation in October begins to fall in the form of snow, the share of solid and mixed precipitation falls from 2 to 10%. The average monthly precipitation decreases by 40-50 mm compared to September, and in some places – 60-70 mm (80 mm in the Barabash region). In some years, the amount of precipitation is several times higher than the long-term average.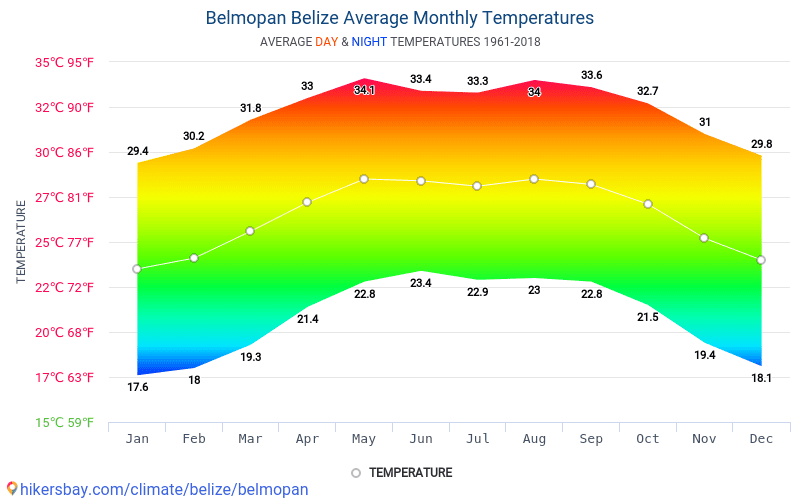 Record values include 338 mm, noted in 1935 year. In dry years, the least amount of precipitation is observed from 1 to 15 mm. The years 1950, 1961, 1962, 1968 were especially dry.
In October, especially dangerous snowfalls are possible in the region, when 20 mm or more falls in 12 hours. Thunderstorms in October are not observed every year and only in the south they occur no more than one day a month. Fog of a radiation nature is most often found in the north. Blizzards in October are rare.
November. The direction of the wind in most of the regions of the region acquires the direction of the main winter monsoon. The number of days with strong winds (15 m/s) is increasing.
In November, especially dangerous winds are observed with a maximum speed of 35-40 m/s and more. From October to November, the most intensive decrease in air temperature by 8-12°C in the annual course is observed everywhere.
Throughout the territory of the region, except for the southern capes and islands of Peter the Great Bay and the southeastern coast, the average monthly air temperature is negative and ranges from -4 to -13°C.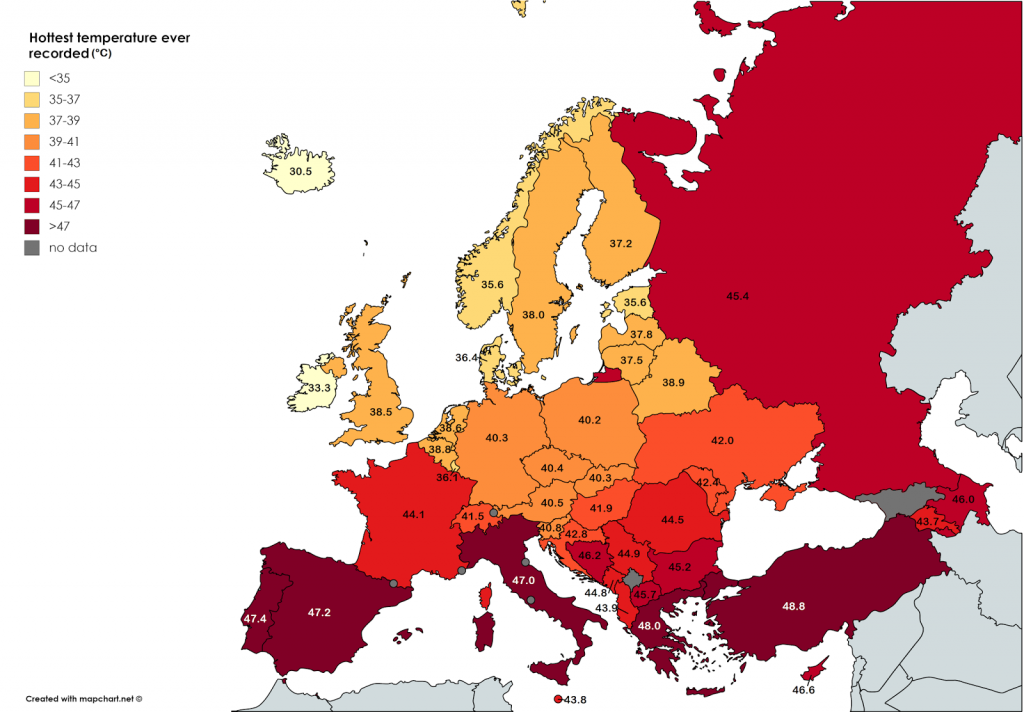 In the first ten days of November, in the southern half of the region, the transition of the average daily air temperature through 0 ° C downwards . A little later on the east coast.
In November at night the air temperature is negative -5…-10°С (on some nights of the second half of the month -10…-15°С). In 2000, in the last five days -22…-27°С, in some places, in the western and central regions -28…-31°С. The value of the absolute minimum is -30…-35 °С, on the coast -17…-24°С.
In the daytime, the air temperature is most often positive in the first half of the month, and negative in the second. The value of the absolute minimum is 31-36°С, on the coast – 18-24°С, in the mountains – up to 40°С; absolute maximum – +12…+21°C in some places, on the Khanka Plain +22…+23°C. The amount of precipitation decreases compared to October and amounts to 17-57 mm.
November is dominated by solid and mixed precipitation (50-80%) with liquid precipitation accounting for 20-50%. The number of especially dangerous snowfalls is noticeably increasing, giving an amount of precipitation of 20 mm or more in 12 hours. In November, the formation of a stable snow cover is noted, with the exception of the western and southern regions of the Khanka Plain and the coast of the Sea of Japan. The average height of snow cover by the third decade of November in the western foothills of the Sikhote-Alin reaches 8-15 mm.
9The last seven years have been the hottest in the history of observations / HB
- Opinions
- Business
- Life
9000 causing wildfires (Photo: REUTERS/Amanda Perobelli/)
Copernicus Climate Change Service researchers say the past seven years have been the hottest on record, with 2021 the fifth warmest year in some regions.
Environmental, human and economic problems associated with high temperatures are already being observed around the world, the scientists noted.
In particular, Europe experienced its warmest summer yet, with temperature records in the western United States and Canada broken by several degrees. Severe forest fires in July and August burned almost entire cities and claimed hundreds of lives.
Video of the Day
“These events are stark reminders to change the way we live, to take decisive and effective steps towards a sustainable society and to work towards reducing net carbon emissions,” explains Carlo Buontempo, director of Climate Change Services Copernicus.
Copernicus data comes from the Sentinel satellite constellation that observes the Earth from orbit, as well as ground level measurements. Observations showed that 2021 was the fifth hottest year on record, slightly warmer than 2015 and 2018. Taken together, the past seven years have been the hottest seven years on record.
The average temperature in 2021 was 1.1-1.2 degrees above the pre-industrial level about 150 years ago.
Read also: Not New Year’s weather. Europe recorded a record high temperature on the night of January 1
At the beginning of the year there were relatively low temperatures compared to recent years, but by June monthly temperatures were at least among the four highest recorded.
Above average locations included the west coast of the United States and Canada, northeastern Canada and Greenland, much of northern and central Africa, and the Middle East.
Cooler sea surface temperatures known as La Niña contributed to below-average temperatures in western and eastern Siberia, Alaska, and the central and eastern Pacific during early and late 2021.
At the same time, a heat wave swept the Mediterranean in July and August, especially affecting Greece, Spain and Italy. Sicily recorded 48.8°C, breaking the European record for the highest temperature by 0.8°C. High temperatures in the eastern and central Mediterranean were followed by intense forest fires, especially in Turkey, but also in Greece, Italy, Tunisia and Algeria.
Europe also experienced extreme wet weather as massive floods devastated parts of Germany, Belgium and the Netherlands. These events were part of the same pattern of weather systems disrupted by climate change.
According to Copernicus experts, in 2021, the concentration of two gases in the Earth’s atmosphere, which significantly contribute to climate change, has increased. Carbon dioxide concentrations reached 414.3 parts per million last year, rising at the same rate as in 2020.
But scientists have noted that the level of methane in the atmosphere has increased to an unprecedented level of about 1876 parts per billion. The rate of methane growth was also faster than in 2020 – Copernicus said both rates were very high compared to satellite data over the past two decades.
Scientists say it’s important to lower levels of methane because it’s more dangerous than CO2 but lingers in Earth’s atmosphere for much less time.
Formerly HB wrote that the researchers, who have been observing the key ice shelf of Antarctica, the Thwaites Glacier, for the third year, found large cracks in its eastern part.
This could end in a complete collapse of the ice shelf in just a few years, researchers warned at a virtual press briefing at the annual meeting of the American Geophysical Union (AGU).
Thwaites Glacier in western Antarctica is the widest glacier on Earth, stretching for about 120 km.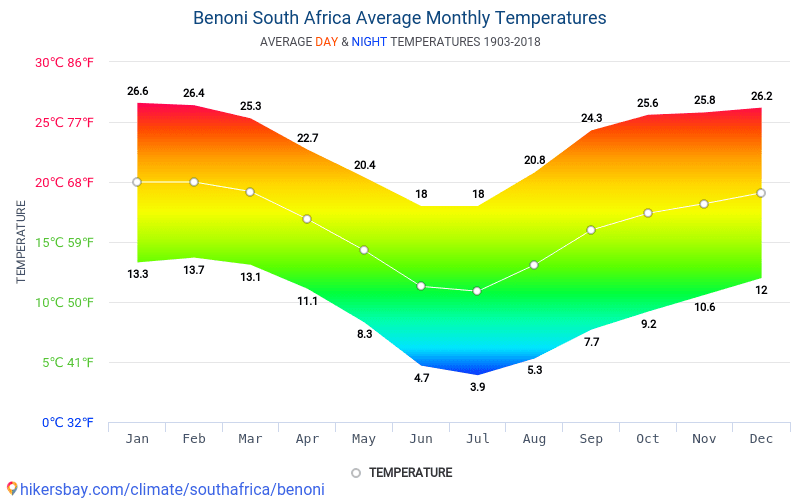

 9°C
9°C
 Para más información o para denegar el consentimiento a las cookies pulse aquí. Al cerrar este banner, desplazarse por la página o hacer clic en cualquiera de sus elementos, usted acepta el uso de cookies.
 Habrá mar de fondo del norte con olas de 1 a 2 metros.
 Probabilidad de lluvias débiles en el norte durante la primera mitad del día. Temperaturas con pocos cambios, con ligero descenso en las máximas de zonas de interior. Viento del nordeste, con intervalos de fuerte en las vertientes este y noroeste, especialmente durante la primera mitad del día, cuando también podrán darse en cumbres. Brisas en costas suroeste.

 Temperaturas con pocos cambios, con ligero descenso de las máximas en la vertiente este. Viento del nordeste, con intervalos de fuerte en las vertientes este y oeste durante la primera mitad del día, así como en el sur de Jandía a últimas horas.
 9°C during the day and +16.7°C at night, which is 4.6°C colder than usual at this time of the year.
 For the next 7 days, the weather in Tenerife, when viewed in detail and by the hour, predicts minimum values of +16°C on Friday 07 October. Visibility in the environment varies from 9 to 10 km, with the worst visibility being October 10 – 9km. During the specified period, 4.6mm of precipitation will fall in the region, with the most precipitation of 3.4mm on Monday 10 October, and the smallest amount of 0mm on Wednesday 12 October. Cloudiness covers the sky by an average of 21%, the least is 3% of clouds in the sky on October 12, and the most is 46% cloudiness on October 10. According to the hysmeteo, the nature of the weather in Tenerife will change for 7 days as follows: at the beginning of the period it is cloudy, and at the end it is clear.
  5°C
5°C 
 +18 ° C
 2 m.
2 m. 
 2 m.
2 m.  rt. Art.
  Art.
Art.  The average wave height is from 60 centimeters to 1 meter, the length reaches 6 meters.
  1 mm.
1 mm.  rt. Art.
  rt. Art.
  rt. Art.
  rt. Art.

 These ingredients offer a variety of uses and contribute appreciably to the healthy and well-balanced nutrition of sportsmen and women, as well as other health-conscious and active people. Additional products like healthy drinks, or powder for making your own energy drinks, meanwhile extend our varieties of products. Not only healthy and innovative – it’s also super delicious (and we’re speaking from experience!).
 Argentinia, Italy or Spain – since 1994 you’ll find an excellent choice of meals and delicious desserts and wine
 So the freshly caught fish doesn’t have to travel a long way to get on your plate. El Anzuelo is specialized in fish and seafood as well as typical Canarian dishes. But with their big range of fresh food they also offer steak and various starters, salads and soups. You will also find an international wine menu including some of the delicate Canarian wines of Tenerife or Lanzarote.
 With a large terrace and small, nicely furnished rooms inside you can enjoy excellent food in a simple, very cozy atmosphere. El Moral combines traditional dishes with the latest cooking trends and a fantastic service.
 Therefore, it’s usual to find places holding competitions to choose the best ones. In Fuerteventura, a jury of leading gastronomy specialists has recently chosen the best tapas of the year. Among the wonderful gastronomical jewels from Oliva district, they highlight Sama Ham – wrapped cheese cream marinated salmon, gofio texture baifo raviolis, and Canarian casserole.
 Goat’s meat, majorero cheeses, traditional gofio, red & green mojos, a wide range of fish and seafood, are just some of the mouth-watering ingredients that make tapas a delicious appetizer.

 Secrets Bahía Real has seven restaurants, two of them on the beach, offering local and international dishes with a personal style that makes them even more special.
  m. (Winter) / 7:30 p.m. – 10:30 p.m. (Summer)
 Ladies must wear a bathing suit wrap or cover-up. No sleeveless shirts for men.
 Canario restaurant is the ideal place to enjoy an unforgettable evening in a sophisticated and elegant environment in which the greatest care is taken over every detail.
 Women: blouses, skirts, slacks or dresses; dress shoes.
 It becomes a magical place for a sensory journey thanks to the select menu of pastas and pizzas offered by our chefs.
 Bar awarded several times.
 0025
0025


 According to Trip.com,

 Oasis Papagayo offers professional services that cannot be found anywhere else on the island, both for groups and individual sports programs. All our visitors will be able to choose between different activities such as cycling, swimming in an Olympic or semi-Olympic pool, triathlon, volleyball, tennis, surfing, supervised workout lessons, yoga and much more. Our sports manager and our professional staff are always happy to help. Due to its geographical features, latitude and excellent weather throughout the year, Fuerteventura, especially the north of the island, attracts more and more people who want to practice their favorite sport or professional athletes in search of the best place for their training. At the gathering you will be provided with conference rooms, coffee breaks once or twice a day. Transfers from the airport to the hotel and from the hotel to the airport, transfers to sports facilities and back. Free WIFI, internet access. Exclusive use of training facilities. Mineral water for daily use during training.
 At the training camp there is an opportunity to organize joint training with local teams. We offer a wide range of accommodation options, ranging from hotels, apartments, villas, sports facilities with accommodation and other accommodation options. The training camp provides an opportunity for individual and group training for children, juniors, professional athletes and amateurs under the guidance of our highly qualified professional trainers. During the gathering, we offer sports massages and rehabilitation. The camps are suitable for both professional athletes and teams, as well as for juniors, children and amateurs. You have the opportunity to purchase a sports package with flights, insurance, visas. In our free time we offer the best excursions and active recreation programs. Our company is a certified sports tourism operator in cooperation with the Ministry of Sports and Tourism – in the winter period, from October to March, it is possible to receive subsidies for the team in order to promote tourism and attract both new and already visited teams, clubs, sports associations and sports sections, funds are allocated to the group leader or customer directly through our accredited company under the current program, in which we are included and carry out the entire operational process for you! In order to get the best price for the training camp, you need to book a year in advance, at least half a year in advance, for coaches, organizers of sports groups, travel agents and sports federations, special conditions apply when booking a training camp.
 La isla y su hábitat marino fueron declaradosReserva de la Biosfera en 2009por la UNESCO. Entre los innumerables atractivos de la zona, destaca el Parque Natural de las Dunas de Corralejo, con sus impresionantes dunas y sus preciosas playas de arena fina y aguas cristalinas, ideales para lapráctica del buceo, el windsurf y otros deportes náuticos. Situado en el centro de Corralejo y a escasos metros de la playa, el h20 Ocean Dunas es un agradable hotel de cuatro estrellasespecializado en vacaciones para adultos. Recientemente renovado, el hotel cuenta con una piscina, jardín tropical, restaurante y bar.
  com you have access to rates from over 70,000 hotels worldwide. These organizations carry out changes, construction and repairs in accordance with their schedule. Data on services and facilities of all types (safe, gym, entertainment programs, etc.) in the hotels listed on www.canarias.com are constantly updated by our suppliers (hotels, boarding houses, tour operators, etc.) and in most cases correspond to the current moment. However, in some cases, this data at the time of the request may be partially out of date. Vallecid S.L., as the owner of the trademark Canarias.com, does not guarantee the absolute accuracy of the information provided. If you would like to receive up-to-date information on all hotel services at the time of booking, you can contact our customer service department from Monday to Saturday from 9until 20:00 by phone 0034922715353 or email
 Teide. You’ll then begin the actual visit where the guide shows the different types of lava and then continue on to study the cave. After equipping you with helmets, a headlamp, and battery pack, you’ll proceed through beautiful gardens to the main entrance of the cave through a rocky path in line formation.
 99
99 9 x 32.9 cms -
 While the volcanic element continues to rage on the neighboring island, the members of the expedition carry out the program of public diplomacy. At one of these meetings on October 7, the first steps of cooperation between the Russian Geographical Society and compatriots in the Canary Islands were outlined.
  Evgeny Kovalevsky, Stanislav Berezkin and a new sailor Ildar Mukharashev spoke about the contribution of Russian navigators to the exploration of the World Ocean and spoke about the friendly mission of the expedition “On the way of Russian navigators around the world”. Carlo Gonzalez and Olga Shuvalova received bandanas from the team, which symbolizes the involvement of their owner in circumnavigating the world. The meeting of the members of the Russian Geographical Society with Olga Shuvalova, who heads the Russian Alliance in the Canary Islands Association, was the first step towards mutual cooperation between the Russian Geographical Society and compatriots in the Canaries. The cooperation agreement between the Association and the Tomsk branch of the Russian Geographical Society was signed on October 7.
  Increasing amounts of red-hot rock are crashing onto the shore: the resulting plateau continues to grow, already reaching an area of more than 46 football fields. Meanwhile, the lava flow stretches over 1,200 meters wide. It has already destroyed a thousand houses along the way. Together with lava, ash clouds are thrown into the air”, – reports InoTV.
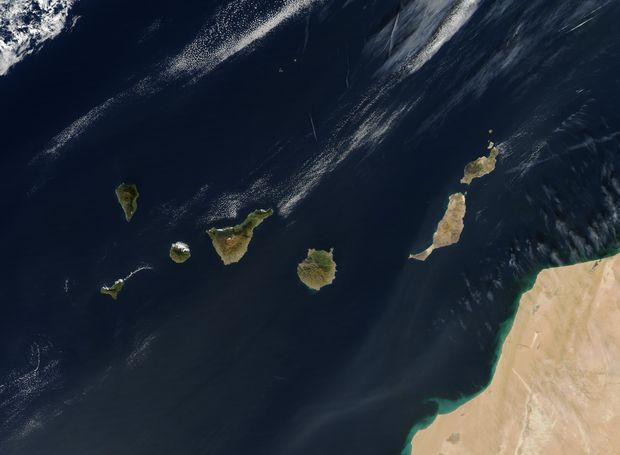
 If you thought you knew The Canaries, Lanzarote will make you think again.


 org/ListItem”> Europe
 Whether you’re after a romantic getaway, a family holiday or a trip with your mates, we’ve got just the thing.
 Subject to availability. Family prices are based on 2 adults and 2 children under 12 sharing a room. Other travel dates are available, supplements may apply. Please use the search box or call for details. For more information please read our Pricing Terms and Conditions.

 With so many inland villages and other coastal accommodation options, there is definitely something for everyone.
  El Cable features golden sand and is famed for its excellent windsurfing and El Reducto boasts white sands and nearby amenities, including kiosks, shops and restaurants.
 Within the resort there is also a swimming pool, tennis court, childrensâ pool and a restaurant. Live music and entertainment are available most nights.
 This three-star hotel is just a stone’s throw away from the beach and offers a dedicated mini waterpark for children and spacious family rooms, as well as a multi-sports court and three bar-restaurants.
 Both of which are houses where the famous artist used to live which have now been converted into art galleries.
 December holidays in Lanzarote have the added advantage of uncrowded beaches so that you can enjoy the coastline and facilities at your leisure.
 Bus tours take visitors around this protected national park; an unmissable experience for its exceptional views.
 Fundación César Manrique is housed in Manrique’s James Bond-style dwelling, set in a lava field and retaining its groovy 1970s furnishings.
 It’s a relatively uninhabited place with a charming, remote atmosphere. There are walks around the island and bicycles to hire. A pleasant café and restaurant on the port will be destination enough for some.

 Here you’ll find lively strands that stretch alongside low-lying resorts including Puerto del Carmen and Costa Teguise. Or discover secluded sands in Papagayo in the south and the neighbouring desert island of Graciosa to the north. There’s also the wine country of La Geria to explore and the unmissable Timanfaya national park, an unforgettable lavascape of brooding peaks where the land is so active it’s still warm to the touch. Lanzarote is also home to hotels aplenty and, with costs rising across the board, it’s worth seeking out one of the island’s all-inclusives — once you’ve booked, there are no hidden costs. With these top hotels you can get ready to holiday without hassle.
  This article contains links which are ads and if you click on a link and buy a product we will earn revenue. These links are signposted with an asterisk. The revenue generated will help us to support the content of this website and to continue to invest in our award-winning journalism.
  The pool bar features a patisserie and there’s a spa and tennis courts.
  Sandos Papagayo
 Aside from the pool bar and main buffet restaurant, all restaurants are à la carte and you’ll find everything from seafood at Oceana to steaks at Bluewater Grill. Rooms are chic, with neutral decor, but for true luxury book a swim-up suite and you’ll get butler service and glorious Atlantic views. The hotel has its own diving centre and there are coral reefs offshore ideal for beginners.
  The bars and restaurants are all family-friendly, with large tables for groups and areas to prepare baby food.
  HD Beach Resort
 Los Zocos Impressive Lanzarote has the ideal location, just 100m from the square’s shops and restaurants, and 200m from Las Cucharas beach. Back at base, there are two pool areas, one with a relaxation pool, the other more geared to activities and featuring a children’s splash zone and two restaurants — you can eat once à la carte in the Italian as part of your all-inclusive package.
 There are two lagoon-style pools and free mini-golf to boot.
  Hotel h20 Rubicon Palace
 For little ones there’s a splash pool with spiral slide, while adults will love winkling out a quiet corner among the palms. Rooms are spacious — many come with separate lounge area — and some sleep up to four, while the restaurants include the main buffet with its live cooking stations and alfresco terrace as well as the a la carte La Nonna for Italian dishes and La Brasserie for French cuisine.
  Dinner is served buffet-style in the main restaurant, while a Canarian restaurant operates on some evenings and there’s also an Asian restaurant serving up sushi. Family-friendly entertainment is on offer daily, including a kids’ club, cabaret acts and fitness classes.
  There’s also a kids’ pool, of course, complete with dragon slide, and a nightly entertainment programme that’s suitable for all ages.

 Petersburg
 5
5  As you know, New Year’s holidays in Europe are very beautiful and interesting, and temperamental Spain makes them even more interesting.

 Of these, tourists go on vacation by domestic flights. The best price for tickets is in November.
  Therefore, the rest will take place among flowers and greenery.
  The latter are producers of local specialties. Cheese, olive oil, wine, liqueurs can not only be tasted or purchased, but you can also try to make it yourself.

 The beaches of the island are small, safe sandy places for the whole family.

 A resort for wealthy tourists, including world stars, is famous for its tolerance for the whims of guests. This is a place of entertainment, in a relaxed atmosphere where you can choose pleasures every day according to your mood: a party on the best beaches, shopping in the stores of world fashion brands, a quiet beach holiday, meeting the dawn on a yacht, surfing, a Greek dinner under the stars.
  Here you can choose a place for swimming according to your taste: from an organized one with bars and restaurants on the shore to a sports one offering various types of water sports. Lovers of “wild” recreation will also find here beaches for themselves.
  It is connected to the mainland by a pontoon bridge, which gives tourists an additional advantage: not to depend on the vagaries of nature and enjoy the scenery almost all year round. Lefkada has a mountainous landscape and lush greenery.
 You can go in search of adventure through horseback riding or cycling. Mountaineering, windsurfing and water skiing also thrive.
  More beautiful than such a location can only be the picturesque flora of Maui. This area is home to many animals that attract with their exclusivity. Some species of dolphins are listed in the Red Book.
  Jamaica always has great weather, a pleasant climate that creates a unique atmosphere for outdoor activities!
  Nearby are many medieval cities, and in June the lavender blooms and the air becomes simply incredible. In the heart of the island, life does not stop day or night! This is not an island for loneliness and tranquility, here you want to live life to the fullest and have fun in the company of friends!
  Located off the coast of Venezuela. In addition to the azure shores and clean beaches, there is a great atmosphere and positive people. Speaking of positive, benevolence, responsiveness and friendliness are provided. People are constantly cheering and enjoying life. There is a feeling of peace. Against the backdrop of beautiful landscapes and climate, this feeling is more than ever useful for a pleasant pastime.
  Toddlers are able to sit in the water for hours up to the navel, exploring the pebbles at the bottom or watching colorful fish, so the descent to the sea should be gentle and safe.
 An additional bonus is the delicious cuisine that can satisfy even the most demanding tourists.

 Of the several thousand wonderful islands, it is impossible to single out a single one to call it universal without a twinge of conscience.
 Supporters of luxury holidays come to Capri: elite boutiques, fashionable restaurants, harbors dotted with expensive yachts absolutely characterize the island.


 Private villas overlooking the clear waters of the Indian Ocean, orange sunsets crowning the end of the day, plentiful citrus treats and the convenient call of a massage therapist will make you forget about everything. The resort has all the conditions for a comfortable “sweet” trip together.


 The Pacific Ocean gives surfers wonderful waves, and the richest underwater world attracts thousands of divers to the most visited resorts in the world. The best vacation here in the calendar winter is in December-February. But if your goal is to save on the trip, then you should fly to Hawaii in April-November.
  The warm ocean and unique nature annually attract hundreds of thousands of tourists from all over the world. Depending on the intended type of vacation, you should also plan the time of your trip to the Seychelles. Diving is best done in spring or autumn, May and October are most favored by sailing and surfing, and for passive relaxation on the beach, the end of summer or the middle of winter is best.
  Holidays in the best five-star Canarian hotels will remain unforgettable even for the most demanding tourists.
  Fort Aguada divides Goa conditionally into northern and southern parts. In the south of the island, boarding houses and hotels are expensive not only by Indian standards, so only wealthy Indians or Europeans come here. But North Goa is the exact opposite – democratic, inexpensive, but noisy. Independent European and American youth live in numerous local settlements, which gave the island worldwide fame.
  A fabulous experience is guaranteed in Bali.
  In this land of eternal summer, a real tropical paradise and all the conditions for a carefree life. Coral islands with snow-white fine sand, framed by the greenery of palm trees and surrounded by warm and incredibly clear waters. Magnificent coral reefs and turquoise lagoons are teeming with vibrant underwater life. Such beauty cannot leave indifferent even a seasoned traveler. Every year, hundreds of thousands of people fly here to dive into the gentle waters of the Indian Ocean. Even those who can’t swim can stand waist-deep in clear water and admire the corals and fish under their feet. Diving and snorkeling enthusiasts will find many places here to admire the underwater beauties and take home unique photographs.
  In Pattaya, there are many expensive hotel complexes designed for families. But the active nightlife brought special glory to the city, when after dark the time of various sex entertainments begins. Walking Street is especially popular with tourists.
  There are other entertainments on Bora Bora: exciting fishing, exciting diving, feeding stingrays and sharks, driving a jeep along mountain roads surrounded by tropical forests, as well as the sea of sun and the singing of birds of paradise.
  The seemingly endless (40 km) beach of Miami Beach is completely built up with luxurious villas and hotels. Nightlife in Miami is incredibly active and concentrated in dozens of nightclubs. There is something to do during the day – visit a tropical garden with exotic flora and fauna, a zoo, the largest aquarium in the United States, the house-museum of E. Hemingway, there is even a police museum. And, of course, swimming in the warm Atlantic Ocean.
  The city has many beautiful mosques, including the famous Jumeirah. Well, the highlight of the resort are artificial bulk islands with a projection in the form of palm trees.
 Here you can both enjoy a relaxing holiday and seek adventure. Especially tourists are attracted by the city of Budva, more precisely, a luxurious resort on the island with a hotel and a private beach.
  Local summer resorts have gained particular popularity thanks to the all-inclusive holiday system. This mode allows any vacationer to completely relax. Every year, about 30 million vacationers from all over Europe rush to take advantage of this privilege. The coast of Turkey is washed by three seas: Black, Mediterranean and Marmara, this could not but make this country a popular tourist destination. Most popular resorts are located on the south coast (Mediterranean Sea) and the west coast (Aegean Sea). Among the most popular cities are Alanya, Antalya, Bodrum, Kemer, Marmaris, Side.
  Diving enthusiasts will not be bored in Egyptian resorts, especially when it comes to the bright beauties of the Red Sea. In sunny Egypt, there are many high-class resorts with impeccable service, and the country itself is famous for its rich historical and cultural heritage. It is also quite safe for vacationers. For several decades, Sharm el-Sheikh has been considered the most popular Egyptian resort, although Hurghada is not inferior to it in terms of beauty and level of comfort. We should also mention such places as Dahab, El Gula, El Ashir.
  And if you really want to get to the island of your dreams – there is always an opportunity!
  Patong Beach is especially popular with a large number of cafes, clubs, restaurants and shows. It is worth noting that the local population of Phuket treats tourists very well.
  There are good sandy beaches and the most beautiful underwater coral world, and while fishing in the open sea, you can catch tuna, hammerhead fish, blue marlin, barracuda.


 This tax can be paid at any bank on the islands.
  Healing springs are used in various salons and SPA-centers.
  At one time, hippies came here and lived in tents without any amenities. In the second half of the 20th century, the Indonesian government decided to rectify the situation and began to develop the infrastructure of the island for tourists to relax. After that, many hotels, restaurants and entertainment centers appeared here. Bali attracts tourists with its tropical forests, pristine landscapes, volcanoes, ancient temples and, of course, endless beaches.
 At the same time, Cuba provides a high level of service.

 If you’re not hiring a car, you can reach the Timanfaya National Park by booking a special coach excursion. It’s one of Playa Blanca Lanzarote most exciting things to do.
 ..
..
 ..
.. In addition, through this area you enter the exclusive community of The Buenaventura Golf & Beach Resort. And on the territory of the tourist complex Playa Blanca Beach Resort is the largest salt water pool in Central America!
 com
com

 1)
1)

 3 Very good beach
 com
com


 The hotel is only 13 miles from Timanfaya National Park. The air-conditioned establishment is 25 miles from Puerto del Rosario Airport and only 15 miles from Lanzarote Airport. This modern hotel offers 388 non-smoking guestrooms and suites.
 Star Prestige is also on-site and open for breakfast and dinner with options like fruit sorbet, cake, salad, and fish. The hotel also houses the El Mirador Snack Bar, Jameos Bar, and a food truck that serves waffles, hotdogs, beer, and more.
 com
com 8
8
 Many different travel sites will offer discounts or deals at different times for rooms at Iberostar Selection Lanzarote Park and KAYAK will provide you with prices from a huge range of travel sites. That means that you can always find a great deal for Iberostar Selection Lanzarote Park.
 6 Good (1,199 reviews)0.18 miBeachfront, Kitchen, kitchenette$50+
 org/” typeof=”BreadcrumbList”>
 536 €Angebote ab 1.536 €
 Erleben Sie unsere Philosophie “How we care” mit mehr als 300 Maßnahmen von der Ankunft in unserem Hotel bis zur Abreise, welche zu jeder Zeit durch unseren eigenen medizinischen Beirat unterstützt wird, der sich aus Experten des öffentlichen Gesundheitswesens zusammensetzt. Alle Umwelt- und Gesundheitsstandards unserer Hotels sind von SGS überprüft. Video Hier: https://bit.ly/2N0AM3k
 Wir stehen Ihnen jederzeit mit einem erstklassigen Service zur Verfügung, sollten Sie sich für IBEROSTAR entscheiden.
 Köstliche Gerichte, Snacks und Getränke werden Sie mit Ausblick auf den Atlantik genießen können. Nehmen Sie Ihr Frühstuck im Restaurant Papagayo zu sich, entspannen Sie beim Abendessen im Restaurant Star Prestige und gehen Sie anschließend in unsere Bar Jameos, um unsere Abendshows mitzuerleben!
 Sie verbringen gern Ihren Urlaub aktiv? Auf Lanzarote finden Sie zahlreiche interessante Ziele für unvergessliche Ausflüge! Nach einem abenteuerlichen Tag können Sie ein erfrischendes Getränk am Pool genießen, bevor anschließend das Abendessen serviert wird.
 September 2022
 Alle Angaben ohne Gewähr und ohne Prüfung durch HolidayCheck. Bitte lesen Sie vor der Buchung die verbindlichen Angebotsdetails des jeweiligen Veranstalters.
 85672827808894,

 Seventy airlines accounted for over 50 commercial operations (includes departures and arrivals) in 2012, with the remaining 140 airlines (for a total of 210) making up 2.1% of the remaining commercial operations.


 The decision was made to build a new facility in the south of the island close to the main tourist resorts.
 From the name it becomes clear that the airport is located in the south of the island. In fact, it was created to serve the most popular resort – Playa de Las Americas, which is only 18 km away.
  Bus routes operated by regular flights: No. 111, No. 343, No. 450.
 Payment is calculated very cleverly with a variable cost per minute. For simplicity, I will write by duration:
  Posted
  The passenger traffic of the airport is more than 7,000,000 passengers per year. South has one terminal.
  Check-in for all flights ends 40 minutes before the time indicated on the tickets.
 La información recogida mediante este tipo de cookies se utiliza en la medición de la actividad de los sitios web, aplicación o plataforma y para la elaboración de perfiles de navegación de los usuarios de dichos sitios, aplicaciones y plataformas, con el fin de introducir mejoras en función del análisis de los datos de uso que hacen los usuarios del servicio.

 P. 35580 de Yaiza, Las Palmas. España. Correo Electrónico:
  js
js Al acceder a tales sitios web usted puede decidir si acepta sus políticas de privacidad y de cookies. Con carácter general, si navega por internet usted puede aceptar o rechazar las cookies de terceros desde las opciones de configuración de su navegador.
 Además, algunos servicios y características pueden no funcionar correctamente (por ejemplo, los inicios de sesión con perfil).
 wikipedia.org/wiki/Cookie_%28inform%C3%A1tica%29.

 – Tratamiento de Datos Personales
 – Derecho a presentar una reclamación ante la Autoridad de control (https://www.aepd.es/reglamento/derechos/index.html) si considera que el tratamiento no se ajusta a la normativa vigente. www.agpd.es. Calle Jorge Juan 6, 28001. Madrid. Datos de contacto para ejercer sus derechos: PUERTO DEPORTIVO RUBICON, S.A. con NIF A35526987, con domicilio en la Calle Berrugo, nº2, Urbanización Castillo del Águila, C.P. 35580 de Yaiza, Las Palmas. España. Correo Electrónico:
  La primera vez que un usuario entre en el sitio web a través de un navegador se instalará esta cookie. Cuando este usuario vuelva a entrar en la web con el mismo navegador, la cookie considerará que es el mismo usuario. Solo en el caso de que el usuario cambie de navegador, se considerará otro usuario
 js
js Al acceder a tales sitios web usted puede decidir si acepta sus políticas de privacidad y de cookies. Con carácter general, si navega por internet usted puede aceptar o rechazar las cookies de terceros desde las opciones de configuración de su navegador.
 Además, algunos servicios y características pueden no funcionar correctamente (por ejemplo, los inicios de sesión con perfil).
 com
com
 The Thin Line ofrece una selección de lo mejor del mundo de la moda con una cuidada selección de firmas y colecciones internacionales de lujo para hombre, mujer y niños. Colección única y original de accesorios, bolsos y zapatos creados por las marcas y estilistas de lujo mejor declaradas y los nuevos diseñadores emergentes más interesantes.
 es
es com
com S. Polo Assn. …and many more.
 com
com A.”, responsable del sitio web, en adelante RESPONSABLE, pone a disposición de los usuarios el presente documento, con el que pretende dar cumplimiento a las obligaciones dispuestas en la Ley 34/2002, de 11 de julio, de Servicios de la Sociedad de la Información y de Comercio Electrónico (LSSICE), BOE N º 166, así como informar a todos los usuarios del sitio web respecto a cuáles son las condiciones de uso. Toda persona que acceda a este sitio web asume el papel de usuario, comprometiéndose a la observancia y cumplimiento riguroso de las disposiciones aquí dispuestas, así como a cualquier otra disposición legal que fuera de aplicación. “PUERTO DEPORTIVO RUBICON, S.A.” se reserva el derecho de modificar cualquier tipo de información que pudiera aparecer en el sitio web, sin que exista obligación de preavisar o poner en conocimiento de los usuarios dichas obligaciones, entendiéndose como suficiente con la publicación en el sitio web de “PUERTO DEPORTIVO RUBICON, S.
 A.”
A.” El RESPONSABLE autoriza expresamente a que terceros puedan redirigir directamente a los contenidos concretos del sitio web, y en todo caso redirigir al sitio web principal http://www.marinarubicon.com/
 El RESPONSABLE no se hace responsable de la información y contenidos almacenados, a título enunciativo, pero no limitativo, en foros, chats, generadores de blogs, comentarios, redes sociales o cualquier otro medio que permita a terceros publicar contenidos de forma independiente en la página web del RESPONSABLE. Sin embargo, y en cumplimiento de lo dispuesto en los artículos 11 y 16 de la LSSICE, se pone a disposición de todos los usuarios, autoridades y fuerzas de seguridad, colaborando de forma activa en la retirada o, en su caso, bloqueo de todos aquellos contenidos que puedan afectar o contravenir la legislación nacional o internacional, los derechos de terceros o la moral y el orden público. En caso de que el usuario considere que existe en el sitio web algún contenido que pudiera ser susceptible de esta clasificación, se ruega lo notifique de forma inmediata al administrador del sitio web. Este sitio web ha sido revisado y probado para que funcione correctamente. En principio, puede garantizarse el correcto funcionamiento los 365 días del año, 24 horas al día.
 Sin embargo, el RESPONSABLE no descarta la posibilidad de que existan ciertos errores de programación, o que acontezcan causas de fuerza mayor, catástrofes naturales, huelgas o circunstancias semejantes que hagan imposible el acceso a la página web.
 Las operaciones previstas para realizar el tratamiento son:

 aepd.es/reglamento/derechos/index.html) si considera que el tratamiento no se ajusta a la normativa vigente. agpd.es. Calle Jorge Juan 6, 28001. Madrid.
 No existe transferencia internacional de datos.

 aepd.es/reglamento/derechos/index.html) si considera que el tratamiento no se ajusta a la normativa vigente. agpd.es. Calle Jorge Juan 6, 28001. Madrid.
 .) que se podrían realizar en nuestras instalaciones.
 La entidad “PUERTO DEPORTIVO RUBICON, S.A.”, no se hace responsable de los comentarios expresados, fotos o vídeos publicados por la comunidad de usuarios, aunque podrá vetar, borrar o eliminar comentarios, fotos o vídeos indecorosos o fuera de lugar. Cualquier responsabilidad acerca de las diferentes plataformas de redes sociales, ver su propia Política de Privacidad.
 El RESPONSABLE informa y garantiza expresamente a los usuarios que sus datos personales no serán cedidos en ningún caso a terceros, y que siempre que realizará algún tipo de cesión de datos personales, se pedirá previamente el consentimiento expreso, informado e inequívoco por parte los Usuarios. Todos los datos solicitados a través del sitio web son obligatorios, ya que son necesarios para la prestación de un servicio óptimo al Usuario. En caso de que no sean facilitados todos los datos, no se garantiza que la información y servicios facilitados sean completamente ajustados a sus necesidades.
 wikipedia.org/wiki/Cookie_%28inform%C3%A1tica%29.

 – Tratamiento de Datos Personales
 – Derecho a presentar una reclamación ante la Autoridad de control (https://www.aepd.es/reglamento/derechos/index.html) si considera que el tratamiento no se ajusta a la normativa vigente. www.agpd.es. Calle Jorge Juan 6, 28001. Madrid. Datos de contacto para ejercer sus derechos: PUERTO DEPORTIVO RUBICON, S.A. con NIF A35526987, con domicilio en la Calle Berrugo, nº2, Urbanización Castillo del Águila, C.P. 35580 de Yaiza, Las Palmas. España. Correo Electrónico:
  La primera vez que un usuario entre en el sitio web a través de un navegador se instalará esta cookie. Cuando este usuario vuelva a entrar en la web con el mismo navegador, la cookie considerará que es el mismo usuario. Solo en el caso de que el usuario cambie de navegador, se considerará otro usuario
 js
js Al acceder a tales sitios web usted puede decidir si acepta sus políticas de privacidad y de cookies. Con carácter general, si navega por internet usted puede aceptar o rechazar las cookies de terceros desde las opciones de configuración de su navegador.
 Además, algunos servicios y características pueden no funcionar correctamente (por ejemplo, los inicios de sesión con perfil).
 The Thin Line offers a selection of the best of the fashion world with a careful selection of international luxury brands and collections for men, women and children. Unique and original collection of accessories, bags and shoes created by the best declared luxury brands and stylists and the most interesting new emerging designers.
 es
es com
com S. Polo Assn. …and many more.
 com
com
 Recipients: No transfer of data is foreseen and there is no international transfer of data. Rights: Access, rectification, deletion, opposition, portability and limitation of processing. Additional Information: See the Privacy Policy in the corresponding section.
 A.”. Finalidad: Gestión integral de las solicitudes de reserva de varadero. Legitimación: Consentimiento del interesado. Destinatarios: no está prevista la cesión de datos y no existe transferencia internacional de datos. Derechos de los interesados: Acceder, rectificar, suprimir, oponerse, portabilidad y limitación del tratamiento. Información Adicional: Ver la Política de Privacidad en el apartado correspondiente.
 Las cookies y otras tecnologías similares tales como local shared objects, flash cookies o píxeles, son herramientas empleadas por los servidores Web para almacenar y recuperar información acerca de sus visitantes, hábitos de navegación que se efectúa desde dicho equipo, así como para ofrecer un correcto funcionamiento del sitio. Mediante el uso de estos dispositivos se permite al servidor Web recordar algunos datos concernientes al usuario, como sus preferencias para la visualización de las páginas de ese servidor, nombre y contraseña, productos que más le interesan, etc.


 P. 35580 de Yaiza, Las Palmas. España. Correo Electrónico:
  js
js Al acceder a tales sitios web usted puede decidir si acepta sus políticas de privacidad y de cookies. Con carácter general, si navega por internet usted puede aceptar o rechazar las cookies de terceros desde las opciones de configuración de su navegador.
 Además, algunos servicios y características pueden no funcionar correctamente (por ejemplo, los inicios de sesión con perfil).
 This location is becoming popular among tourists nowadays because there you can enjoy shopping, try different kinds of sea activities, and eat delicious local meals with the view to the sea, all within a day!
 You can find here everything you’re looking for.
 There you will find a great variety of jewellery, handicrafts, leather goods, organic products, creams and treatments made with aloe vera, t-shirts, pareos, wines, tablecloths etc. You cannot fail to find the ideal gift and the most original souvenir there.
  Depending on what kind of fish you want to get, you can choose the best fishing style like jigging or deep-sea fishing.
 You can travel on deck or in the interior of the boat, depending on your preference. In addition, you can board your pet, your surfboard or your bike at no extra cost. There are days when fun dolphins follow the trail left by the ship across the Atlantic. It’s really beautiful! But if you are one who likes to have the day fully organized, you can book a tour. They are great fun!
 You will discover a very special marine atmosphere. Marina Rubicón is the sophisticated ingredient that completes your vacation in the Canary Islands.
 Towels and bed linen are provided.
 You can use the Special Requests box when booking, or contact the property directly using the contact details found on your booking confirmation.


 Until 1755, a Moorish castle was located on the site of the palace. In the middle of the 18th century, it lost its strategic importance, and since it was located in a very picturesque place, it was destroyed and rebuilt into a chic palace. This beautiful building has more than 2 thousand rooms and halls, which store valuable collections of antique chandeliers, clocks, furniture, musical instruments, weapons and works of art.
 Another great place in the resort town is the Kikoland club, perfect for spending leisure time here with the whole family. At the service of visitors there are swimming pools, … Open
  One of the main symbols of the region are old windmills, only a few of them have survived to the present day. In … Open
  And here you can see concrete sculptures, … Open
  17237018
 The private bathroom comes with a bath, hairdryer and free toiletries. Guests are offered a choice of pillows and bed linen. Children are considered guests under the age of 12 years.
  )
)  You can use the Special Requests box when booking, or contact the property directly using the contact details found on your Booking Confirmation.
 4
4  4
4  Set in Playa Blanca, 700 meters from Puerto Deportivo de Marina Rubicón, El Partido Villas features mountain views and free WiFi.

 This service may be chargeable.


 Sounds like the best Christmas adventure ever!
  For more than 20 years he has been living and acquainting travelers with the history and culture of the islands and has experience in sea travel. She took part in the passage along the Canary Islands on the frigate Shtandart.
  org/ImageObject”>
 01 Day 1: Introduction to Lanzarote. Parking in the marina of Arrecife (Lanzarote)
 Then we will return to the marina, take cabins, unpack our things and rest a little, and in the evening we will again go for a walk – to the crater of the Huerve volcano. There is an incredible starry sky! Well, a light dinner and wine will complete the picture of the evening. We sleep on yachts. By the way, in Lanzarote, more precisely in its water area, there is a unique underwater museum (Museo Atlantico). Hundreds of human sculptures are at the bottom in various compositions, and this is an incredible sight. An underwater descent to the museum requires two days of preparation, so those who decide to participate, today before the program we will deliver to the dive center for the first dive (there are two in total, on the first day – training in the pool, on the second – in the Atlantic), but after they be able to join the main group.
  Along the east coast we descend to Playa Blanca Marina Rubicon. A distance of 18 nautical miles is about three hours of passage (we will already moor at 11 am). You can start the program. Those who dive into the maritime museum leave, and the rest of the group goes to explore the south of the island along the “wine” road. Lanzarote is a landmass of three hundred volcanoes. In this soil grows a special variety of grapes – the Malvasia family, from which delicious wines are made. Scattered along the southern coast are wine estates – bodegas, where peasants produce wines according to old recipes that are passed down from generation to generation. The volume of production is so small that these wines can only be tasted here, which we will do when we visit the owner of one of the wineries for a tasting. We continue our journey in the Timanfaya National Park, whose landscapes allow you to travel back a million years BC. Here we will have lunch, and part of it we will cook ourselves, right on the grill from the heat of the volcano.
 After we meet with our divers who were in the maritime museum, and we go to the olivine beach, which consists of a mixture of volcanic sand and minerals – olivines, which appear on the beaches as a result of long-standing eruptions. Victoria will tell stories about these stones and teach you how to make amulets, because according to local beliefs, an olivine amulet helps to realize your plans, and the beginning of a new year always means new plans. After the walk, we will return to the marina, have a rest and go to the town of Playa Blanca, where, as in all of Spain during the New Year holidays, the traditional “procession of the three kings” takes place. A good end to the day. We sleep on yachts.
  Today we will see several important sights. First of all, let’s go to the town of La Oliva, which appeared more than five hundred years ago and was the capital and outpost of the island. Then we will go to the lighthouse in the fishing town of El Cotillo: it offers magnificent views of the ocean and the coast of Lanzarote. Well, let’s go to dinner in a typical Canarian restaurant for our own, where there are no tourists and culinary tricks are passed down from generation to generation. The next stop is the town of Betancuria, in the vicinity of which we will visit one of the goat farms, where we will meet the owner. If you wish, we will look at the production process, and, of course, we will try cheeses. We will return to the marina along the mountain serpentine, with a stop at the towers with panoramic views of the island. We will have dinner right on the yachts!
  Then we continue our program in the south of the island of Fuerteventura. These places are interesting for their landscapes and the almost complete absence of people. Ahuy is hidden among these landscapes: a fishing village nestled on a strip of black volcanic sand. There are several restaurants here where we will try freshly caught fish. Then we will continue the program in the ancient town of Pajara and go to rest in the marina where our yachts are.
 By the way, Salvador Dali himself was an admirer of his work! We will take a break for lunch, and for this we will go to a village in the vicinity of Las Palmas, to visit a Canarian family. During conversations, we will prepare national dishes together: Canarian potatoes and Ropa Vieja. After lunch, we will say goodbye to new acquaintances and continue our journey through the old towns. The highlight of the day will be a visit (and, of course, a tasting) to the rum factory, which was founded in 1884. We will have dinner on our return to the marina.
