Europe Just Had Its Warmest Winter Since at Least 1850, Report Says
December 2019-February 2020 global temperature departures from average (degrees Celsius) highlight the most anomalous winter warmth was in parts of Europe and Russia.
(Copernicus Climate Change Service/ECMWF)
It was the warmest December-to-February period on record in Europe, one agency reported.
This past winter crushed the previous European record by over 1 degree Celsius.
It was also Russia’s warmest winter dating to 1891.
Meteorological winter (December 2019 through February 2020) was Europe’s warmest in at least 170 years, according to a new report.
The average temperature in Europe over winter’s three months was 6.1 degrees Fahrenheit above average, topping the previous record-warm European winter of 2015-16 by about 2.5 degrees, according to a monthly report from the Copernicus Climate Change Service (C3S).
This was staggering when considering temperature data averaged over an entire continent over a three-month period.
When comparing this C3S dataset dating to 1979 with a number of other datasets dating to the mid-19th century, C3S also said this was the warmest European winter going back to at least 1850.
European winter (December through February) temperature departures from average, in degrees Celsius, from 1850 to 2020. The record-setting winter 2019-20 is shown by the red bar at the far right of the graph.
(Copernicus Climate Change Service/ECMWF)
It was the warmest winter on record in Russia, dating to 1891, according to a report issued Thursday from the Hydrometcenter of Russia.
Parts of western and central Russia were 10 to 14 degrees warmer than average from December through February.
The HoR report said Moscow’s winter temperature, averaged from December through February, was above freezing for the first time on record.
Advertisement
It was also a record-warm winter in Finland, where no measurable snow was recorded from January through February in the capital, Helsinki, for the first time on record.
C3S also found February global temperatures trailed only 2016 as the warmest February in records dating to 1979.
This is impressive considering a record-tying strong El Niño was in place in February 2016, but not in 2020.
February monthly record highs were shattered in at least nine European countries in the last week of the month, as documented by Finnish Meteorological Institute researcher Mika Rantanen.
A prime reason for the warm winter was a persistently strong polar vortex high above the Earth in the stratosphere, keeping colder air fenced in near the pole, rather than plunging it deep into Europe and locking it in place.
Global reports on February and winter temperatures from NASA, NOAA and the Japan Meteorological Agency will be released later this month.
The Weather Company’s primary journalistic mission is to report on breaking weather news, the environment and the importance of science to our lives. This story does not necessarily represent the position of our parent company, IBM.
Column: Europe’s gas inventories get respite from warm weather: Kemp
LONDON, Jan 6 (Reuters) – Europe’s gas inventories swelled at the end of December and beginning of January thanks to a combination of mild weather and an influx of liquefied natural gas cargoes.
The unusual seasonal increase has eased fears stocks would drop to critically low levels before the end of winter and reversed the blistering rally in prices and calendar spreads.
Benchmark futures prices based on deliveries on the Dutch Title Transfer Facility (TTF) in February 2022 have fallen to around 93 euros per megawatt-hour from 180 euros on Dec. 21.
The spread between futures prices for deliveries in March and April, at the end of winter, has shrunk to a backwardation of 8 euros per MWh from 38 euros on Dec. 21.
An extended period of unusually warm weather over Christmas and New Year has cut heating demand for both gas and gas-fired electricity, cutting the drawdown of inventories (https://tmsnrt. rs/3JK2CgD).
Temperatures across the main population centres of Northwest Europe were well above the seasonal average for 7-10 days from just before Christmas into the first week of January.
Over the same period, pipeline flows and the arrival of LNG cargoes resulted in the fastest additions to storage for more than three months.
As a result, the storage balance in the European Union plus Britain swung to a net injection of almost 2,500 Gigawatt-hours on Jan. 2 from a net withdrawal of 8,000 GWh on Dec. 22.
In the 10 days ending on Jan. 4, estimated inventories declined by just 3,200 GWh, the smallest drawdown over the same period for a decade.
More than half of the winter heating season still lies ahead but the risk of inventories falling to critically low levels by its end and creating shortages has reduced sharply.
If there is a sustained spell of cold weather later in January or February, prices and spreads are likely to spike higher.
But the combination of mild weather, LNG arrivals and depressed consumption over the Christmas-New Year period has reduced some of the previous extreme pressure on gas stocks and prices.
Related columns:
– European gas stocks deplete rapidly in cold start to winter (Reuters, Dec. 7) read more
– European gas prices climb again, inventories under pressure (Reuters, Nov. 29) read more
– Europe’s gas prices surge to avert risk of winter shortage (Reuters, Oct. 6) read more
Editing by Emelia Sithole-Matarise
Our Standards: The Thomson Reuters Trust Principles.
Opinions expressed are those of the author. They do not reflect the views of Reuters News, which, under the Trust Principles, is committed to integrity, independence, and freedom from bias.
where to go and where to relax on the sea?
Site sections
general information
Abkhazia
Austria
Armenia
Belarus
Belgium
Great Britain
Vietnam
Germany
Greece
Georgia
Dominican Republic
Egypt
Israel
India
Indonesia
Iraq
Spain
Italy
Canada
Cyprus
China
Cuba
Maldives
Moldova
Nigeria
UAE
Portugal
Russia
Romania
USA
Thailand
Tanzania
Tunisia
Turkey
Uzbekistan
Ukraine
Philippines
Finland
France
Montenegro
Czech
Sweden
Search on the site
Yandex advertising
Cooperation
VKontakte group
Yandex advertising
Site statistics
0016
Beach holidays in February: where to go and where to relax on the sea?
Let February be the shortest month of the year, but being the last in the winter calendar, it seems endless. During the February frosts, we all miss the warmth and sun very much. Traveling to warmer countries this time of year can provide a welcome respite before the final push for spring. At the same time, a pleasant surprise awaits all those who plan to take a vacation and go to the sea: the idea of going on vacation at this time can be very successful! In this article, we will tell you why it is beneficial to relax in the winter, and list best beach destinations in February .
Tour prices
So, let’s see why the last winter month is a good time to plan a vacation at sea. New Year’s turmoil with the search for tours is over, and with it the high prices have disappeared. It is not surprising that during the whole month you can buy vouchers to the most popular resorts quite inexpensively. This turns out to be a very good reason to plan your vacation for February. If we compare the cost of a February beach holiday with the prices for trips in other months of the year, then in most cases the comparison will be clearly in favor of the first option. But there is another reason: by February, we all get tired of the cold winter with short gray weekdays, and a few days spent on the sunny coast near the warm sea can cheer up and add strength in anticipation of spring. But first you need to decide where exactly to go for a beautiful tan and bright positive emotions.
– Egypt – UAE – India – Thailand – Canaries
Egypt
The end of winter can hardly be called the best time for tours in Egypt , however, a beach holiday in Egypt at this time of the year is possible. Daytime air temperature is kept at +20-25˚C, and sea water near the coast warms up to +20˚C. Be sure to take into account that at this time the winds blow on the Red Sea, and it is quite cool to get out of the water after swimming. In the evenings and at night the air temperature can drop to +10-15˚C. Compared to Russian frosts, this, of course, is not so terrible, but when choosing Egypt, you need to remember this. But the prices for tours to the country of the pharaohs at this time of the year can more than outweigh all the shortcomings: trips to Hurghada and Sharm el-Sheikh are very cheap.
UAE
Weather in the United Arab Emirates in February may well be suitable for sunbathing. Swimming in the sea at this time of the year can be cool – the water temperature is kept at + 17-20˚C, but many hotels have heated pools in winter. But for sunbathing there will be no problems at all. Usually in February in UAE there are clear days, and the air warms up to +25˚C. Occasional showers are possible, but they usually only bring freshness. Beach holidays are best combined with sightseeing or shopping. Prices for city hotels in Dubai, Sharjah, Abu Dhabi and other emirates in the shortest month of the year can surprise even the most economical traveler.
India
Weather conditions in India in February make holidays on the beaches Goa as comfortable as possible for travelers. The average air temperature is +30˚C, while the sea water temperature near the coast is kept at +26˚C. Thanks to the beautiful weather and low prices for tours to India, vacationers from all over the world gather at local resorts in winter. At the same time, North Goa is more suitable for young people who prefer parties and vibrant nightlife, and South Goa offers its guests a more respectable and relaxing holiday on the coast.
Thailand
Among the places to go in winter, Thailand is considered one of the best destinations in terms of price-quality ratio. The weather in February on the beaches of Pattaya and Phuket is wonderful. During the day, the air warms up to + 30-32˚C, and the temperature of sea water does not fall below + 27-28˚C. At the same time, the prices for charter flights and accommodation are relatively low.
At the same time, a little more expensive you can relax at sea in other countries of Southeast Asia – in Vietnam or Cambodia.
Canaries
Canary Islands are able to offer vacationers comfortable conditions all year round. So in the last month of winter, the weather at Tenerife will not present unpleasant surprises to tourists. Warm sunny days will delight you with an average daily temperature (+20-25˚C), and sea water near the coast warms up to +20-22˚C. A pleasant addition to the good weather conditions this month will be the carnival, which is held annually on Tenerife . It is believed that this is the second largest carnival after the Brazilian one. Although it is precisely because of this event that prices for accommodation in February may be slightly higher than usual.
Even at the end of winter, Caribbean countries ( Dominican Republic , Mexico and Cuba ) can be considered as beach destinations, as well as Maldives .
In general, February is a very good month for planning a vacation at sea. Even the most expensive beach holidays are discounted at this time. And thanks to the visa-free regime with many warm countries, just a few days before departure, you can find great options at an attractive price (hot tours).
Useful tips for travelers:
General information | 02/10/2022 | Views: 642
Tags: Vietnam, Mexico, India, sea, tour, dominican Republic, Thailand, tenerife, beach, Cambodia, vacation, cuba, egypt, UAE, canaries, maldives, goa, february
Total comments: 0
Travel from A to Z — site for travelers , which will tell you everything about traveling from A to Z. On the site you can not only learn something new and interesting, you can also share personal experiences, talking about your travels. In section USEFUL INFORMATION we will tell you everything about tourism . This section presents not only 90 Thailand , Tunisa , Turkey , Uzbekistan , Ukraine , Finland , France , Montenegro , Czech , , , , , , , , , , and 90
We will tell you about the most interesting sights of and about the features of the national cuisine of the countries you are interested in. In section TRAVEL STORIES the authors and visitors of the site will tell about their travels and adventures. To post to site travel4us.ru article or story about your trip, you need to contact the site administrators. Contacts of administrators can be found in section ABOUT . Section ABOUT EVERYTHING IN THE WORLD publishes articles about music ( MUSICAL PAUSE ) and literature ( READING ) about travel. Don’t forget to check out the section THIS IS INTERESTING , the name says it all! In section PHOTOS are published beautiful photo cards made by the authors of the site and our readers during their travels. Didn’t find what you were looking for? Then you need SITE MAP , or try SEARCH ON SITE .
WARNING! Copying materials from this site is allowed only when creating a direct hyperlink to the site travel4us.ru .
Is the Baltics suitable for holidays in February: the weather and where to go
Despite the fact that the Baltics are in the north of Europe, the climate here is quite mild in winter, which means that you can have a great holiday for those who love fun winter fun. The cold season is also suitable for healing and treatment, since in the Baltic countries – Latvia, Lithuania, Estonia – there are a lot of spa hotels and treatment centers. Such a pastime can be diversified by visiting interesting events. And you can also spend Valentine’s Day truly romantic.
Weather
Air temperature
Ventspils: -4˚С.. +1˚С
Liepaja: 0˚С.. +4˚С
Riga: -6˚С.. +2˚С
Jurmala: -4C.. +4C
Vilnius: -9C.. +2C
Druskininkai: -8C.. +2C
Klaipeda: -11C N.. +4˚С
Palanga: -5˚С.. +4˚С
Siauliai: -5˚С.. +1˚С
Juodkrante: -2˚С.. +4˚С
Värska: -11˚C.. +1˚C
Kuressaare: -5˚C.. +2˚C
Narva: -9˚С.. +3˚С
Otepaa: -11˚С.. +2˚С
Pärnu -12˚С.. +1˚С
Toila: -9˚С. +2˚С
Tallinn: -7˚С .. +3˚С
February, as it should be for a winter month, is one of the coldest months of the year. According to temperature indicators, we can say that the winter in the Baltics is quite mild. But you shouldn’t flatter yourself too much: sometimes the thermometer drops much lower – up to 15-22 degrees below zero. This is typical at the beginning of the month. In the last ten days of February, as a rule, the temperature is set with a “+” sign, but it is still too early to talk about spring. The maximum to which the air warms up is +5.
Water temperature
Of course, people don’t go swimming in the Baltic Sea in winter, as the temperature stays around 0 degrees. Lakes in Estonia are completely frozen. But you can enjoy winter fishing.
Weather features
Let February be one of the coldest months of the year, but it’s good that strong winds are behind us. It becomes easier to endure low temperatures, even if the mercury column of the thermometer drops to -15..-20. The sun does not indulge in its appearance, for the most part the February days are cloudy. Warm clothes come in handy in this weather.
Airline prices
A flight to the Baltic States is not too expensive if you choose flights to one of the capitals without transfers or, in extreme cases, with one transfer. Flights to other airports are much more costly and time consuming.
The most budget accommodation option can be found in Riga: the capital of Latvia offers accommodation in a double room of a three-star hotel from 105 euros for 7 nights. Most of all, you will have to leave for accommodation for 7 nights also in Riga – in Ventspils – from 315 euros. Other cities and resorts fit in the range from 126 to 250 euros for 7 nights.
What countries have to offer
The winter entertainment season continues in the Baltic States. Skiing, alpine skiing, sledding and ice skating can be found in any of the three states. However, there are a number of activities that may well become the highlight of your holiday.
Among them are Tartu Marathon (February 8, 2015) and Rybfest (February 13-15, 2015). The first of the competitions is one of the oldest skiing competitions not only in Europe but also in the world. Passes through the territory of the open-air park – the Park of Earthly Deities, which is the largest among its kind in Estonia.
The rocky region of Puerto de Mogan in Gran Canaria, in Spain
Weather in February
February, the last month of the winter in Gran Canaria, is also an enjoyable month, with an average temperature varying between 15.7°C (60.3°F) and 18.3°C (64.9°F).
Temperature
February is the coldest month, with an average high-temperature of 18. 3°C (64.9°F) and an average low-temperature of 15.7°C (60.3°F).
Humidity
In Gran Canaria, the average relative humidity in February is 73%.
Rainfall
In Gran Canaria, in February, during 6.8 rainfall days, 8mm (0.31″) of precipitation is typically accumulated. Throughout the year, in Gran Canaria, there are 77.4 rainfall days, and 116mm (4.57″) of precipitation is accumulated.
Daylight
The average length of the day in February is 11h and 13min. On the first day of February, sunrise is at 07:48 and sunset at 18:42. On the last day of the month, sunrise is at 07:27 and sunset at 19:01 WET.
Sunshine
The month with the least sunshine in Gran Canaria is February, with an average of 8h of sunshine.
UV index
January through May, November and December, with an average maximum UV index of 5, are months with the lowest UV index in Gran Canaria. A UV Index of 3 to 5 symbolizes a medium health hazard from exposure to the Sun’s UV rays for the ordinary person. Note: The daily maximum UV index of 5 in February interpret into the following advice: Take precautions – Protection against sun damage is advised. The Sun’s most intense and consequently most harmful UV radiation during midday hours should be decreased by minimizing exposure and seeking shade. On bright days sunglasses that block both UVA and UVB rays should be worn. A hat with a wide brim is extremely helpful, as it can prevent roughly 50% of UV radiation from reaching the eyes.
[Resources]
report this ad
FAQ
What is the coldest month in Gran Canaria?
The coldest month in Gran Canaria, Spain, is February, with an average high-temperature of 18.3°C (64.9°F) and an average low-temperature of 15.7°C (60.3°F).
What is the temperature in February in Gran Canaria?
The average high-temperature, in February, is 18.3°C (64.9°F), while the average low-temperature is 15. 7°C (60.3°F).
What is the average humidity in February in Gran Canaria?
In February, the average relative humidity in Gran Canaria, Spain, is 73%.
How many days does it rain in February in Gran Canaria?
In Gran Canaria, Spain, in February, it is raining for 6.8 days, with typically 8mm (0.31″) of accumulated precipitation.
What is the average length of the day in February in Gran Canaria?
In Gran Canaria, the average day length in February is 11h and 13min.
When is the sunrise / sunset in February in Gran Canaria?
On the first day of February in Gran Canaria, Spain, sunrise is at 07:48 and sunset at 18:42. On the last day of the month, sunrise is at 07:27 and sunset at 19:01 WET.
What is the month with the least sunshine in Gran Canaria?
February has the least sunshine of the year, with an average of 8h of sunshine.
How long on average sun shines in February in Gran Canaria?
In Gran Canaria, the average sunshine duration in February is 8h.
What is the month with the lowest UV index in Gran Canaria?
The months with the lowest UV index are January through May, November and December, with an average maximum UV index of 5.
What is the UV index intensity in February in Gran Canaria?
In February, the average daily maximum UV index in Gran Canaria, Spain, is 5. A UV Index value of 3 to 5 symbolizes a moderate health threat from unsafe exposure to Sun’s UV rays.
Today
Tomorrow
Long-term
YearJFebruaryMAMJJASOND
Jan
February
Mar
Average high temperature
18.5°C 65.3°F
18.3°C 64.9°F
19°C 66.2°F
Average low temperature
16.2°C 61.2°F
15.7°C 60.3°F
16.1°C 61°F
Average pressure
1022.2mbar 30.19inHg
1020.3mbar 30.13inHg
1018.2mbar 30.07inHg
Average wind speed
20.1km/h 12.5mph
21.7km/h 13.5mph
20.9km/h 13mph
Average max. wind speed
20. 9km/h 13mph
22.6km/h 14mph
21.6km/h 13.4mph
Average wind speed gusts
27.3km/h 17mph
29km/h 18mph
27.7km/h 17.2mph
Average humidity
70%
73%
75%
Average rainfall
8mm 0.31″
8mm 0.31″
17mm 0.67″
Average rainfall days
6.8
6.8
7.6
Average daylight
10h 37min
11h 13min
12h 1min
Average sunshine
8h 18min
8h 0min
8h 24min
Average sunshine days
19.7
15.8
19.5
Average UV index
5
5
5
Average cloud cover
31%
34%
32%
Average visibility
10km 6.2mi
10km 6.2mi
10km 6.2mi
Average high temperature in February: 18.3°C
The warmest month (with the highest average high temperature) is August (24.2°C). The month with the lowest average high temperature is February (18.3°C).
Average low temperature in February: 15.7°C
The month with the highest average low temperature is October (21°C). The coldest month (with the lowest average low temperature) is February (15.7°C).
[Resources]
Average pressure in February: 1020.3mbar
The month with the highest atmospheric pressure is January (1022.2mbar). The month with the lowest atmospheric pressure is August (1015.5mbar).
[Resources]
Average wind speed in February: 21.7km/h
The windiest month (with the highest average wind speed) is July (25.7km/h). The calmest month (with the lowest average wind speed) is October (16km/h).
[Resources]
Average humidity in February: 73%
The months with the highest relative humidity are July and August (80%). The months with the lowest relative humidity are January and December (70%).
[Resources]
Average rainfall in February: 8mm
The wettest month (with the highest rainfall) is October (19mm). The driest month (with the least rainfall) is July (2mm).
[Resources]
Average rainfall days in February: 6.8 days
The month with the highest number of rainy days is November (10.8 days). The month with the least rainy days is June (3.8 days).
[Resources]
Average daylight in February: 11h and 13min
The month with the longest days is June (Average daylight: 13h and 53min). The month with the shortest days is December (Average daylight: 10h and 25min).
Average sunshine in February: 8h and 0min
The month with the most sunshine is August (Average sunshine: 9h and 18min). The month with the least sunshine is February (Average sunshine: 8h and 0min).
[Resources]
Average sunshine days in February: 15.8 days
The month with the most sunshine days is July (24.7 days). The month with the least sunshine days is November (14 days).
[Resources]
Average UV index in February: 5
The months with the highest UV index are June, July, August, September and October (UV index 6). The months with the lowest UV index are January, February, March, April, May, November and December (UV index 5).
[Resources]
Average cloud cover in February: 34
The month with the most cloud cover is November (Cloud cover 36). The month with the least cloud cover is August (Cloud cover 25).
[Resources]
Average visibility in February: 10km
The months with the highest visibility are January, February, March, April, May, June, July, August, September, October, November and December (10km). The months with the lowest visibility are January, February, March, April, May, June, July, August, September, October, November and December (10km).
[Resources]
Best Times to Spend Your Vacations on The Canary Islands
Most suitable times to plan a family vacation on the Canary Islands are between March and May and from September to November. Winter and summer are the seasons that allure loads of tourists to the Canary Islands, which make accommodations a bit expensive. However, in spring and fall, the Canaries continue to offer the same pleasant weather as the peak seasons, if we exclude the tourist crowds.
Best Times to Spend Your Vacations on The Canary Islands
December to February
The Canaries are famous for receiving a flock of Europeans who look for an escape from cold in the winter months. The islands receive lots of older tourists during these months, those wanting to bask in warm weather, despite knowing that it may be too cold for sunbathing. Average temperatures in the Canary Islands hover between 15C to 21C (60F to 71F) and make them a perfect choice for pleasant strolls along stunning beaches.
Winters also ushers in The Carnival of Santa Cruz de Tenerife, held each February in Santa Cruz de Tenerife, the capital of the largest of the Canary Islands, and attracts tourists from all over the world. It’s modelled after Brazil’s vibrant festival and considered the world’s second-best Carnival in the world. If we talk about the influx of tourism and festivals in the Canary Islands, you may face trouble securing accommodations- or at least affordable ones. So, it advised that plan your vacation at least several months in advance.
Key Events:
Carnaval de Tenerife (Tenerife, February)
Lanzarote Marathon (Lanzarote, December)
The Canary Islands Music Festival (All Islands, January-February)
March-May
The spring months are known as a sweet season for tourism and offer a break in the influx of tourists that alight upon the islands during winter and summer.
Although the week of Easter also experiences a burst of tourists, you can find affordable hotel rate during these months. Also, expect temperatures to range between the lower 60s to the lower 70s.
Key Events:
Rally Islas Canarias (Gran Canaria, March)
Semana Santa (All Islands, March or April
Ironman Lanzarote (Lanzarote, May)
Corpus Christi (All Islands, May-June)
June-August
Europeans, families, and college kids flock to the Canaries in the summer. Especially, during the August holiday. Temperatures rise to their highest during the span of these three months- daily highs in Santa Cruz, Tenerife, touch the 80s in August- the probability of rainfall is next to nothing.
Key Events:
Corpus Christi (All Islands, May-June)
Festival of Saint John (Tenerife & San Juan, June)
September – November
Fall happens to be another season in Tenerife where you can cherish the manifold charms of this archipelago of islands. And that too without facing hoarded tourists or increased hotel rates.
While, by this time, summer passes, the islands still offer best beach weather: Average temperatures drop from the low 80s to the mid-70s F between September to November. Also, you may experience a few rainy days during the season.
Key Events:
Fiesta de San Andres (Tenerife, November)
Although the Canary Islands’ pleasant climate conditions give them the nickname ‘Islands of Eternal Spring’ and the visitors all year round weather, it’s wise to know the forecast of the place beforehand to avoid any hassle and mismanagement of things. Because we all know that bad weather can ruin all the fun and enjoyment of our vacations.
Weather in Santa Cruz de Tenerife in February. Average sea water temperature and air temperature. Detailed data for 2021-2022.
Weather in Santa Cruz de TenerifeFebruary
Average temperature during the day:
18.7°C
Average temperature at night:
16.4°C
Sea water temperature:
19.0°C
Number of sunny days:
13 days
Day length:
10.9 – 11.6 hours
Number of rainy days:
2 days
Rainfall:
33.8 mm
Above are the average weather data for Santa Cruz de Tenerife in February. You can find information about air temperature, water temperature, precipitation, cloudiness and daylight hours, which were calculated based on observations over the past three years.
weather now
Santa Cruz de Tenerife
Sea water temperature
Santa Cruz de Tenerife
Monthly weather in Santa Cruz de Tenerife
January
April
July
October
February
May
May
August
November
March
June
September
December
Air temperature in February, °C
The highest daily temperature in February 2022 was 22 °С. While the minimum temperature at night dropped to 15 °C. The average day and night temperatures during February are 19. 4 °C and 17.4 °C, respectively.
Sea temperature in Santa Cruz de Tenerife in February, °C
The average sea temperature in Santa Cruz de Tenerife in February 2022 was 19.5°C . While the minimum and maximum sea water temperatures reached 19.2°C and 19.9°C respectively.
Sunny, cloudy and overcast days, %
Most of February in Santa Cruz de Tenerife there are sunny days, but cloudy and overcast days are also not uncommon.
Precipitation in February, mm
Precipitation in Santa Cruz de Tenerife in February is 33.8 mm. Thus, February is one of the rainiest months of the year.
Average wind speed in February, m/s
Average wind strength in February is 5.1 m/s.
Average daily hours of sunshine
This graph shows the average number of hours per day during which direct sunlight reaches the earth’s surface. This indicator is influenced by both the length of daylight hours and cloud cover in the daytime. In Santa Cruz de Tenerife, the average daily sunshine in February is: 7.3 h
Climate and weather in Tenerife in February
day
+19
evening
+18
+18
+18
°C . The data is obtained according to our Tenerife weather archive.
Cloudy
clear – 13 days overcast – 15 days
Wind
average wind speed is 3 (m/s)
Pressure
760 mm Hg
Autumn
Average temperature in Tenerife in February by years
Average daily and evening temperature in Tenerife in February by years for the period from 2002 to 2012. Number of cloudy and clear days, pressure and wind speed.
2012
2011
2010
2009
2008
200214
2006-2002
9000 9000 9000
007
Blood pressure mmHg Art.
Wind speed m/s
Day
+19
Clear – 2 days Overcast – 25 days
760
9
Evening Overcast – 27 days Day 9
761
60007
+20
Clear – 10 days Overcast – 18 days
765
3
evening
Overcast – 0 days
day Overcast – 27 days
757
3
Evening
+20
Clear – 1 day Overcast – 27 days
756
3
+19
Clear – 6 days. Overcast – 22 days
760
3
Evening
+18
Clear – 5 days Overcast – 22 days
759
3
Day
+20
Clear – 4 days Overcast – 25 days
761
3
Evening
+19
Clear – 8 days Overcast – 21 days
759
2
Day
+20
0005
Clear – 3 days Overcast – 25 days
764
2
Evening
+19
Clear – 8 days Overcast – 20 days
763
2
Temperature archive in Tenerife in February
The graph displays the average temperatures in Tenerife in February in the evening and daytime.
We make the most from 40 years of historical weather data to predict the best weather conditions.
Selection of world’s favourite destinations
Deciding on where to go for a holiday is hard sometimes. Get inspired by the most popular destinations.
16 500 000 weather records
We aggregate data from combining multiple weather sources to ensure accuracy of the highest order.
Where do you want to go?
When do you want to go?
What do you want to do?
Season
Day temperature
> 16 °C
36
Night temperature
-6
> 6 °C
30
Sea temperature
16
> 18 °C
32
Wet days per month
2
< 15
20
Europe
City
Tartu
February
-2
°C
Sea
0
°C
Rainy days
10 /month
January
-2
°C
February
-2
°C
March
3
°C
Europe
City
Pärnu
February
-1
°C
Sea
0
°C
Rainy days
10 /month
January
-1
°C
February
-1
°C
March
2
°C
Europe
City
Tallinn
February
-2
°C
Sea
1
°C
Rainy days
10 /month
January
-1
°C
February
-2
°C
March
2
°C
Europe
City
Lithuania
February
0
°C
Sea
1
°C
Rainy days
11 /month
January
0
°C
February
0
°C
March
4
°C
Europe
Nature
City
Finland
February
-4
°C
Sea
0
°C
Rainy days
10 /month
January
-4
°C
February
-4
°C
March
1
°C
Europe
Beach
City
Latvia
February
0
°C
Sea
1
°C
Rainy days
9 /month
January
0
°C
February
0
°C
March
4
°C
North America
Nature
City
Michigan
February
1
°C
Sea
2
°C
Rainy days
10 /month
January
-1
°C
February
1
°C
March
6
°C
Weather overview
In February in Estonia, the average air temperature ranges from -1. 8 °C (28.8 °F) during the day to -7.5 °C (18.5 °F) at night. There are 10 days of rain on average, where the rainfall is 34 mm (1.35 in).
Are there good conditions to visit in Estonia in February?
In February there are not good conditions to visit Estonia. A relatively low temperature of -1.8 °C (28.8 °F) may be ideal for walking or outdoor activities, but some people may have a different idea of the holiday. The night temperature of -7.5 °C (18.5 °F) is not inviting for evening and night activities except for visiting a bar and having beer or two.
How many days of precipitation on average can I expect in Estonia in February?
In February in Estonia, we can expect 10 days to be rainy, that is, days when precipitation exceeds 2 mm (0.08 in). Converted to days of the week, this means that it will occur on an average of 2.3 days of the week, or in general – 33 % days.
What temperature can I expect during the day in Estonia in February?
The average daily temperature in Estonia in February is -1. 8 °C (28.8 °F). Don’t forget to pack a warm jacket, gloves and several layers of clothing. It can be really cold with all the usual phenomena like freeze, snow, icy wind.
How heavy is the precipitation in Estonia in February?
In February in Estonia, there is 34 mm (1.35 in) rainfall, which means on average 1 mm (0.04 in) rainfall per day.
What is the air temperature in February in Estonia at night?
The average night temperature in Estonia in February is -7.5 °C (18.5 °F). The nights will be cool, layers of clothes will be needed for evening and morning walks, the hotel should be equipped with heating.
Is Estonia rainier in February than in January?
No, February in Estonia is not a rainier month than January.
Is there a dry season in Estonia in February?
No, February is not a dry month in Estonia, expect rain approximately 10 days in a month.
Is February part of the wet season in Estonia?
No, there is no wet season in Estonia in February – you can expect 10 days of rain during the month.
Can I expect a freeze in Estonia in February?
It is possible that it will be freezing in February in Estonia, night temperatures will be -7.5 °C (18.5 °F) on average.
How windy is Estonia in February?
In February in Estonia, there will be an average wind scale of 4.1.
How long is the day (from dawn till dusk) in Estonia in February?
The length of daylight in Estonia in February is 9 hours.
Is the weather in Estonia warmer in February than in March?
No, in Estonia in February the temperature is not higher than in March.
Croatia in February: Travel Tips, Weather & More
Weather
The second coldest month of the year, February continues to see snow in the interior of Croatia and rain on the coast, with average daily temperatures running from 34°F (1°C) to 48°F (9°C). Though there’s a chill in the air, February is altogether pleasant if you dress appropriately and stay out of the 57°F (14°C) sea. Signs of spring are just barely showing, and the days are getting longer with around 10 hours of daylight.
Crowds & Costs
Still considered offseason, February is a great time to visit Croatia. There are few crowds along the popular Dalmatian coast and Istrian Peninsula, granting you an all-access pass to Adriatic views unhindered by tourists and selfie sticks. It’s important to note, though, that many hotels, restaurants, and bars are closed in the coastal towns and islands (though something is always open), and ferries operate on a reduced schedule.
Skiing is popular in February, with many visitors heading to the slopes outside Zagreb and Platak. Their hills are uncrowded, and seasonal, weekly, and daily passes are reasonably priced in relation to other popular ski destinations throughout Europe. February kicks off the fast-approaching coming of spring with Mardi Gras celebrations across the country. If you’re coming to Croatia during the Rijeka Carnival and the Feast of St. Blaise in Dubrovnik, booking accommodation reservations well in advance is best.
Where to Go
Croatia is quickly becoming a year-round destination and offers much in the way of culture and nature. Most travelers will either begin or end their stay with a few days in Zagreb—choosing from an array of museums, restaurants, parks, and even a little skiing. Twenty minutes outside the capital, you’ll find yourself amid the silvery beech trees and snow-covered pines of MedvednicaMountain. A couple of hours west brings you to Platak for additional skiing options (and a bonus view of the sea).
A stop in the port city of Rijeka along the Kvarner Gulf for a taste of carnival should not be missed. And while Rijeka is considered the best carnival choice, there are other great options to choose from, like Samobor (outside of Zagreb), followed by Zadar and Dubrovnik, both further south along the Dalmatian Coast.
What to Do
February marks the beginning of the end of the ski season, making it a great time to take advantage of Sljeme Ski Resort to hit the slopes. If skiing isn’t your thing, there are plenty of other options to explore Medvednica Mountain, including hiking and sledding.
Photographers will enjoy discovering Plitvice Lakes National Park’s seasonal transformation, snow-covered pines, and frozen lakes and waterfalls. Gourmands will appreciate tasty eats at restaurants typically booked during peak season. And there’s no more fitting time than February to duck out of the cold and into the clever Museum of Broken Relationships in Zagreb or any other cultural sightseeing stop.
Events in February
Lent and Carnival, nationwide. Festivities last to the end of the month, if not into early March (depending on when Ash Wednesday falls). Party with the best of them in the Italianate city of Rijeka, though if you’d prefer a less massive city-wide party, visit Zadar or Dubrovnik.
Rijeka Carnival, Rijeka. Over 20,000 performers take to the streets in Croatia’s largest carnival drawing in more than 100,000 visitors to this port city. Running from mid-January and leading up to Ash Wednesday, this massive carnival features street parties, masked balls, concerts, and pageants.
Zagrebdox, Zagreb. With the end of February comes this week-long documentary film festival held at the Kaptol Boutique Cinema and features films made around the region.
Feast of St Blaise, Dubrovnik. The patron saint of Dubrovnik is honored in this city-wide party that has been ongoing since 972 CE and has remained mostly unchanged since.
More Helpful Information
Croatia in January Croatia in March Best Time of Year to Visit Croatia How Many Days to Spend in Croatia
Europe Peak weather for two weeks, Europe Peak weather forecast for 14 days, Castile and León, Spain.
GISMETEO: Europe Peak weather for two weeks, Europe Peak weather forecast for 14 days, Castile and León, Spain.
Go to the mobile version
CP
26 OKT
Th
27
PT
28
SB
29
Sun
9000,0002
PN
9000 31
W 9000 ° 1,000 BT November 1 November 1 November 1 November 1
Wed
2
Th
3
PT
4
SB
5
Sun
6
Mon 745
+337
+745
+236
+846
+134
+439
−228
032
−327
+337
9000 —425
+134
22 −621
+134
−818
+236
−523
+134
−523
032
−523
+134
−327
−228
9000 −425
maximum windows, maximum speed of wind. /CKM/h
precipitation, mm
Print …
It is time to change the rubber Read more0003
−228
−130
−327
Wind, m/h
CP
26 Oct
30
Mon
31
W
1 November
CP
2
Th
3
PT
4
SB
5
Sun
6
PN
9000 9000 9000 9000 9000 7
VT
8
The maximum wind speed, m/cm/h
pollen, points
CP
26 OKT
30
Mon
31
W
1 November
CP
2
Th
3,0002 PT
4
SB
5
Sun
6
PN
PN 9000Pressure, mmHg Art. GPA
CP
26 Oct
Th
27
PT
28
SB
29
Sun
30
PN
31
9000 BT 9000 2 1 November 1 November
2
Thu
3
Fri
4
Сб
5
Вс
6
Пн
7
Вт
8
566754
563750
568757
565753
569758
566754
566754
565753
566754
564752
566754
562749
565753
562749
568757
563750
571761
567756
5667554
Пт
4
Сб
5
Вс
6
Пн
7
Вт
8
67
52
57
50
76
84
79
82
61
51
78
74
9000
85
Geomagnetic activity, KP-index
CP
26 OKT
0003
28
SB
29
BC
30
PN
31
W
1 November
CP
2
PE 9000 3 9000
5
Sun
6
Mon
7
W
8
Preciscration
Temperature
Wind
Cloud
Kamaleno
Cabrales
Suns
Siliorigo-de-Liebana
Peniyamelier-Bach
Llynes
Ribadedeva
Kangas-de-Onis
Val-de-San-vicee
Rionans
Ribadeseli
Vellya-Vellya-Vellya -Rio-Carrion
San Vicente-de-la-Barker
Valdaliga
Kabuerniga
Valderrood
Santibanyes-la-cana
KASO
server-de-pisuerga
Gvardo 9000 Gvardo 9000 Gvardo
003
Ruente
Los Tojos
Pilonia
Where to go in Europe in February?
in February
The most beautiful places
February is in the heart of winter and brings us cool weather. There is no shortage of trump cards on the travel side this month. It’s even the perfect time to go on vacation. Some destinations in Europe are sunny even in winter, while others, less warm, have something cultural to offer. Here are all our tips for deciding where to travel in Europe in February.
Best Destinations
If you miss the sun and dream of mild temperatures, you can easily find places in Europe to warm up and let you store your winter coat during your stay.
Greece is very pleasant to visit in February: if the sea is a little cool for swimming, the weather is no less sunny, with pleasant temperatures that can sometimes even exceed 25 °C. This is an opportunity to enjoy many historical monuments to visit in a more relaxed and less touristy atmosphere.
The same applies to Italy, Sicily and Spain. These countries have an incredible cultural richness that you can experience between a boat trip and a tasting at a local restaurant.
Another plus: these countries, especially their coasts, attract fewer tourists at this time of the year, which means you will get great deals on your stay.
Our resorts
Gregolimano
Greece
4 tridents
Ski holidays
Ski lovers can stay in France and enjoy several ski resorts scattered throughout the country: the Jura, the northern and southern Alps, the massif central, the Vosges and the Pyrenees.
All these areas have an excellent reputation and allow you to ski without leaving the country, which is interesting to lower the price of your stay.
In addition to the French borders, you can choose no less important destinations. First we think of the Italian Alps, real wonders of nature that offer ski slopes in a green area.
Think, for example, of Italy, Greece or Sicily. These countries are rich in historical past, the remains of which can be admired even in the smallest villages.
La Gomera February Weather, Average Temperature (Spain)
Daily high temperatures are around 71°F, rarely falling below 67°F or exceeding 76°F. The lowest daily average high temperature is 70°F on February 4.
Daily low temperatures are around 61°F, rarely falling below 57°F or exceeding 65°F. The lowest daily average low temperature is 61°F on February 10.
For reference, on August 21, the hottest day of the year, temperatures in La Gomera typically range from 72°F to 82°F, while on February 8, the coldest day of the year, they range from 61°F to 70°F.
Average High and Low Temperature in February in La GomeraFeb112233445566778899101011111212131314141515161617171818191920202121222223232424252526262727282856°F56°F58°F58°F60°F60°F62°F62°F64°F64°F66°F66°F68°F68°F70°F70°F72°F72°F74°F74°F76°F76°F78°F78°FJanMarFeb 470°FFeb 470°F61°F61°FFeb 2871°FFeb 2871°F61°F61°FFeb 1671°FFeb 1671°F61°F61°F
The daily average high (red line) and low (blue line) temperature, with 25th to 75th and 10th to 90th percentile bands. The thin dotted lines are the corresponding average perceived temperatures.
The figure below shows you a compact characterization of the hourly average temperatures for the quarter of the year centered on February. The horizontal axis is the day, the vertical axis is the hour of the day, and the color is the average temperature for that hour and day.
Average Hourly Temperature in February in La Gomera
Average Hourly Temperature in February in La GomeraFeb112233445566778899101011111212131314141515161617171818191920202121222223232424252526262727282812 AM12 AM2 AM2 AM4 AM4 AM6 AM6 AM8 AM8 AM10 AM10 AM12 PM12 PM2 PM2 PM4 PM4 PM6 PM6 PM8 PM8 PM10 PM10 PM12 AM12 AMJanMarcoolcoolcomfortablecomfortable
frigid 15°F freezing 32°F very cold 45°F cold 55°F cool 65°F comfortable 75°F warm 85°F hot 95°F sweltering
The average hourly temperature, color coded into bands. The shaded overlays indicate night and civil twilight.
The month of February in La Gomera experiences essentially constant cloud cover, with the percentage of time that the sky is overcast or mostly cloudy remaining about 28% throughout the month.
The clearest day of the month is February 18, with clear, mostly clear, or partly cloudy conditions 73% of the time.
For reference, on November 14, the cloudiest day of the year, the chance of overcast or mostly cloudy conditions is 39%, while on July 19, the clearest day of the year, the chance of clear, mostly clear, or partly cloudy skies is 98%.
Cloud Cover Categories in February in La Gomera
Cloud Cover Categories in February in La GomeraFeb11223344556677889910101111121213131414151516161717181819192020212122222323242425252626272728280%100%10%90%20%80%30%70%40%60%50%50%60%40%70%30%80%20%90%10%100%0%JanMarFeb 171%Feb 171%Feb 2872%Feb 2872%Feb 1172%Feb 1172%clearmostly clearpartly cloudymostly cloudyovercast
The percentage of time spent in each cloud cover band, categorized by the percentage of the sky covered by clouds.
A wet day is one with at least 0.04 inches of liquid or liquid-equivalent precipitation. In La Gomera, the chance of a wet day over the course of February is essentially constant, remaining around 10% throughout.
For reference, the year’s highest daily chance of a wet day is 12% on February 9, and its lowest chance is 0% on July 17.
Probability of Precipitation in February in La Gomera
Probability of Precipitation in February in La GomeraFeb11223344556677889910101111121213131414151516161717181819192020212122222323242425252626272728280%0%2%2%4%4%6%6%8%8%10%10%12%12%JanMarFeb 912%Feb 912%Feb 19%Feb 19%Feb 2810%Feb 2810%rain
The percentage of days in which various types of precipitation are observed, excluding trace quantities: rain alone, snow alone, and mixed (both rain and snow fell in the same day).
Rainfall
To show variation within the month and not just the monthly total, we show the rainfall accumulated over a sliding 31-day period centered around each day.
The average sliding 31-day rainfall during February in La Gomera is essentially constant, remaining about 0.6 inches throughout, and rarely exceeding 1.7 inches.
Average Monthly Rainfall in February in La Gomera
Average Monthly Rainfall in February in La GomeraFeb11223344556677889910101111121213131414151516161717181819192020212122222323242425252626272728280.0 in0.0 in0.5 in0.5 in1.0 in1.0 in1.5 in1.5 in2.0 in2.0 in2.5 in2.5 inJanMarFeb 10.6 inFeb 10.6 inFeb 280.6 inFeb 280.6 inFeb 110.6 inFeb 110.6 in
The average rainfall (solid line) accumulated over the course of a sliding 31-day period centered on the day in question, with 25th to 75th and 10th to 90th percentile bands. The thin dotted line is the corresponding average snowfall.
Over the course of February in La Gomera, the length of the day is increasing. From the start to the end of the month, the length of the day increases by 41 minutes, implying an average daily increase of 1 minute, 31 seconds, and weekly increase of 10 minutes, 37 seconds.
The shortest day of the month is February 1, with 10 hours, 53 minutes of daylight and the longest day is February 28, with 11 hours, 34 minutes of daylight.
Hours of Daylight and Twilight in February in La Gomera
Hours of Daylight and Twilight in February in La GomeraFeb11223344556677889910101111121213131414151516161717181819192020212122222323242425252626272728280 hr24 hr4 hr20 hr8 hr16 hr12 hr12 hr16 hr8 hr20 hr4 hr24 hr0 hrJanMarnightnightdaydayFeb 110 hr, 53 minFeb 110 hr, 53 minFeb 2811 hr, 34 minFeb 2811 hr, 34 min
The number of hours during which the Sun is visible (black line). From bottom (most yellow) to top (most gray), the color bands indicate: full daylight, twilight (civil, nautical, and astronomical), and full night.
The latest sunrise of the month in La Gomera is 7:55 AM on February 1 and the earliest sunrise is 21 minutes earlier at 7:34 AM on February 28.
The earliest sunset is 6:48 PM on February 1 and the latest sunset is 19 minutes later at 7:08 PM on February 28.
Daylight saving time is observed in La Gomera during 2022, but it neither starts nor ends during February, so the entire month is in standard time.
For reference, on June 21, the longest day of the year, the Sun rises at 7:12 AM and sets 13 hours, 56 minutes later, at 9:08 PM, while on December 21, the shortest day of the year, it rises at 7:55 AM and sets 10 hours, 22 minutes later, at 6:17 PM.
Sunrise & Sunset with Twilight and Daylight Saving Time in February in La Gomera
Sunrise & Sunset with Twilight and Daylight Saving Time in February in La GomeraFeb11223344556677889910101111121213131414151516161717181819192020212122222323242425252626272728282 AM4 AM6 AM8 AM10 AM12 PM2 PM4 PM6 PM8 PM10 PM12 AM2 AMJanMar7:34 AM7:34 AMFeb 287:08 PMFeb 287:08 PM7:55 AM7:55 AMFeb 16:48 PMFeb 16:48 PM7:45 AM7:45 AMFeb 167:00 PMFeb 167:00 PMSolarMidnightSolarMidnightSolarNoonSunriseSunset
The solar day over the course of February. From bottom to top, the black lines are the previous solar midnight, sunrise, solar noon, sunset, and the next solar midnight. The day, twilights (civil, nautical, and astronomical), and night are indicated by the color bands from yellow to gray.
The figure below presents a compact representation of the sun’s elevation (the angle of the sun above the horizon) and azimuth (its compass bearing) for every hour of every day in the reporting period. The horizontal axis is the day of the year and the vertical axis is the hour of the day. For a given day and hour of that day, the background color indicates the azimuth of the sun at that moment. The black isolines are contours of constant solar elevation.
Solar Elevation and Azimuth in February in La Gomera
Solar Elevation and Azimuth in February in La GomeraFeb112233445566778899101011111212131314141515161617171818191920202121222223232424252526262727282812 AM12 AM2 AM2 AM4 AM4 AM6 AM6 AM8 AM8 AM10 AM10 AM12 PM12 PM2 PM2 PM4 PM4 PM6 PM6 PM8 PM8 PM10 PM10 PM12 AM12 AMJanMar00101020203030404000101020203030404050
northeastsouthwest
Solar elevation and azimuth over the course of February 2022. The black lines are lines of constant solar elevation (the angle of the sun above the horizon, in degrees). The background color fills indicate the azimuth (the compass bearing) of the sun. The lightly tinted areas at the boundaries of the cardinal compass points indicate the implied intermediate directions (northeast, southeast, southwest, and northwest).
The figure below presents a compact representation of key lunar data for February 2022. The horizontal axis is the day, the vertical axis is the hour of the day, and the colored areas indicate when the moon is above the horizon. The vertical gray bars (new Moons) and blue bars (full Moons) indicate key Moon phases. The label associated with each bar indicates the date and time that the phase is obtained, and the companion time labels indicate the rise and set times of the Moon for the nearest time interval in which the moon is above the horizon.
The time in which the moon is above the horizon (light blue area), with new moons (dark gray lines) and full moons (blue lines) indicated. The shaded overlays indicate night and civil twilight.
Feb 2022
Illumination
Moonrise
Moonset
Moonrise
Meridian Passing
Distance
1
0%
8:22 AM
ESE
7:15 PM
WSW
–
1:49 PM
S
227,586 mi
2
3%
9:06 AM
ESE
8:22 PM
WSW
–
2:44 PM
S
230,245 mi
3
8%
9:44 AM
ESE
9:25 PM
W
–
3:34 PM
S
233,564 mi
4
15%
10:18 AM
E
10:25 PM
W
–
4:21 PM
S
237,237 mi
5
23%
10:50 AM
E
11:22 PM
W
–
5:05 PM
S
240,942 mi
6
33%
11:20 AM
E
–
–
5:47 PM
S
244,381 mi
7
42%
–
12:18 AM
W
11:51 AM
ENE
6:30 PM
S
247,306 mi
8
50%
–
1:13 AM
WNW
12:24 PM
ENE
7:14 PM
S
249,539 mi
9
62%
–
2:08 AM
WNW
12:59 PM
ENE
7:59 PM
S
250,971 mi
10
71%
–
3:04 AM
WNW
1:38 PM
ENE
8:47 PM
S
251,570 mi
11
79%
–
3:59 AM
WNW
2:22 PM
ENE
9:36 PM
S
251,369 mi
12
87%
–
4:52 AM
WNW
3:11 PM
ENE
10:27 PM
S
250,461 mi
13
93%
–
5:43 AM
WNW
4:04 PM
ENE
11:18 PM
S
248,981 mi
14
95%
–
6:31 AM
WNW
5:00 PM
ENE
–
–
15
97%
–
7:14 AM
WNW
5:58 PM
ENE
12:09 AM
S
247,089 mi
16
100%
–
7:53 AM
WNW
6:57 PM
ENE
12:58 AM
S
244,948 mi
17
100%
–
8:29 AM
WNW
7:55 PM
ENE
1:45 AM
S
242,707 mi
18
98%
–
9:02 AM
W
8:54 PM
E
2:31 AM
S
240,485 mi
19
94%
–
9:34 AM
W
9:53 PM
E
3:15 AM
S
238,362 mi
20
87%
–
10:06 AM
W
10:52 PM
E
4:00 AM
S
236,379 mi
21
79%
–
10:39 AM
W
11:54 PM
ESE
4:46 AM
S
234,551 mi
22
69%
–
11:16 AM
WSW
–
5:35 AM
S
232,885 mi
23
50%
12:58 AM
ESE
11:57 AM
WSW
–
6:27 AM
S
231,396 mi
24
46%
2:05 AM
ESE
12:44 PM
WSW
–
7:24 AM
S
230,128 mi
25
34%
3:12 AM
ESE
1:38 PM
WSW
–
8:25 AM
S
229,163 mi
26
23%
4:17 AM
ESE
2:40 PM
WSW
–
9:29 AM
S
228,614 mi
27
14%
5:18 AM
ESE
3:47 PM
WSW
–
10:32 AM
S
228,608 mi
28
7%
6:11 AM
ESE
4:55 PM
WSW
–
11:33 AM
S
229,252 mi
We base the humidity comfort level on the dew point, as it determines whether perspiration will evaporate from the skin, thereby cooling the body. Lower dew points feel drier and higher dew points feel more humid. Unlike temperature, which typically varies significantly between night and day, dew point tends to change more slowly, so while the temperature may drop at night, a muggy day is typically followed by a muggy night.
The chance that a given day will be muggy in La Gomera is essentially constant during February, remaining around 0% throughout.
The highest chance of a muggy day during February is 1% on February 20.
For reference, on August 29, the muggiest day of the year, there are muggy conditions 56% of the time, while on January 14, the least muggy day of the year, there are muggy conditions 0% of the time.
Humidity Comfort Levels in February in La Gomera
Humidity Comfort Levels in February in La GomeraFeb11223344556677889910101111121213131414151516161717181819192020212122222323242425252626272728280%0%10%10%20%20%30%30%40%40%50%50%60%60%70%70%80%80%90%90%100%100%JanMarFeb 201%Feb 201%Feb 10%Feb 10%Feb 110%Feb 110%humidhumidcomfortablecomfortabledrydry
The percentage of time spent at various humidity comfort levels, categorized by dew point.
This section discusses the wide-area hourly average wind vector (speed and direction) at 10 meters above the ground. The wind experienced at any given location is highly dependent on local topography and other factors, and instantaneous wind speed and direction vary more widely than hourly averages.
The average hourly wind speed in La Gomera is essentially constant during February, remaining within 0.2 miles per hour of 12.9 miles per hour throughout.
For reference, on July 17, the windiest day of the year, the daily average wind speed is 15.3 miles per hour, while on October 7, the calmest day of the year, the daily average wind speed is 10.2 miles per hour.
The highest daily average wind speed during February is 13.2 miles per hour on February 28.
Average Wind Speed in February in La Gomera
Average Wind Speed in February in La GomeraFeb11223344556677889910101111121213131414151516161717181819192020212122222323242425252626272728280 mph0 mph5 mph5 mph20 mph20 mph25 mph25 mph30 mph30 mphJanMarFeb 2813. 2 mphFeb 2813.2 mphFeb 112.7 mphFeb 112.7 mphFeb 1612.9 mphFeb 1612.9 mph
The average of mean hourly wind speeds (dark gray line), with 25th to 75th and 10th to 90th percentile bands.
The hourly average wind direction in La Gomera throughout February is predominantly from the north, with a peak proportion of 54% on February 28.
Wind Direction in February in La Gomera
Wind Direction in February in La GomeraENFeb11223344556677889910101111121213131414151516161717181819192020212122222323242425252626272728280%100%20%80%40%60%60%40%80%20%100%0%JanMareastnorthwestsouth
northeastsouthwest
The percentage of hours in which the mean wind direction is from each of the four cardinal wind directions, excluding hours in which the mean wind speed is less than 1.0 mph. The lightly tinted areas at the boundaries are the percentage of hours spent in the implied intermediate directions (northeast, southeast, southwest, and northwest).
La Gomera is located near a large body of water (e.g., ocean, sea, or large lake). This section reports on the wide-area average surface temperature of that water.
The average surface water temperature in La Gomera is essentially constant during February, remaining around 67°F throughout.
Average Water Temperature in February in La Gomera
Average Water Temperature in February in La GomeraFeb112233445566778899101011111212131314141515161617171818191920202121222223232424252526262727282865°F65°F66°F66°F67°F67°F68°F68°F69°F69°F70°F70°FJanMarFeb 167°FFeb 167°FFeb 2866°FFeb 2866°FFeb 1167°FFeb 1167°F
The daily average water temperature (purple line), with 25th to 75th and 10th to 90th percentile bands.
Definitions of the growing season vary throughout the world, but for the purposes of this report, we define it as the longest continuous period of non-freezing temperatures (≥ 32°F) in the year (the calendar year in the Northern Hemisphere, or from July 1 until June 30 in the Southern Hemisphere).
Temperatures in La Gomera are sufficiently warm year round that it is not entirely meaningful to discuss the growing season in these terms. We nevertheless include the chart below as an illustration of the distribution of temperatures experienced throughout the year.
Time Spent in Various Temperature Bands and the Growing Season in February in La Gomera
Time Spent in Various Temperature Bands and the Growing Season in February in La GomeraFeb11223344556677889910101111121213131414151516161717181819192020212122222323242425252626272728280%100%10%90%20%80%30%70%40%60%50%50%60%40%70%30%80%20%90%10%100%0%JanMar100%Feb 15100%Feb 15100%Jan 1100%Jan 1coolcomfortablewarm
frigid 15°F freezing 32°F very cold 45°F cold 55°F cool 65°F comfortable 75°F warm 85°F hot 95°F sweltering
The percentage of time spent in various temperature bands. The black line is the percentage chance that a given day is within the growing season.
Growing degree days are a measure of yearly heat accumulation used to predict plant and animal development, and defined as the integral of warmth above a base temperature, discarding any excess above a maximum temperature. In this report, we use a base of 50°F and a cap of 86°F.
The average accumulated growing degree days in La Gomera are increasing during February, increasing by 415°F, from 498°F to 913°F, over the course of the month.
Growing Degree Days in February in La Gomera
Growing Degree Days in February in La GomeraFeb1122334455667788991010111112121313141415151616171718181919202021212222232324242525262627272828500°F500°F600°F600°F700°F700°F800°F800°F900°F900°F1,000°F1,000°FJanMarFeb 1498°FFeb 1498°FFeb 28913°FFeb 28913°FFeb 11652°FFeb 11652°FFeb 21805°FFeb 21805°F
The average growing degree days accumulated over the course of February, with 25th to 75th and 10th to 90th percentile bands.
This section discusses the total daily incident shortwave solar energy reaching the surface of the ground over a wide area, taking full account of seasonal variations in the length of the day, the elevation of the Sun above the horizon, and absorption by clouds and other atmospheric constituents. Shortwave radiation includes visible light and ultraviolet radiation.
The average daily incident shortwave solar energy in La Gomera is increasing during February, rising by 1.0 kWh, from 4.3 kWh to 5.3 kWh, over the course of the month.
Average Daily Incident Shortwave Solar Energy in February in La Gomera
Average Daily Incident Shortwave Solar Energy in February in La GomeraFeb11223344556677889910101111121213131414151516161717181819192020212122222323242425252626272728280 kWh0 kWh2 kWh2 kWh3 kWh3 kWh4 kWh4 kWh5 kWh5 kWh5 kWh5 kWh6 kWh6 kWh7 kWh7 kWhJanMarFeb 14.3 kWhFeb 14.3 kWhFeb 285.3 kWhFeb 285.3 kWhFeb 164.9 kWhFeb 164. 9 kWh
The average daily shortwave solar energy reaching the ground per square meter (orange line), with 25th to 75th and 10th to 90th percentile bands.
For the purposes of this report, the geographical coordinates of La Gomera are 28.100 deg latitude, -17.133 deg longitude, and 0 ft elevation.
The topography within 2 miles of La Gomera is essentially flat, with a maximum elevation change of 0 feet and an average elevation above sea level of 0 feet. Within 10 miles is also essentially flat (0 feet). Within 50 miles is also essentially flat (0 feet).
The area within 2 miles of La Gomera is covered by shrubs (73%) and cropland (16%), within 10 miles by water (66%) and shrubs (17%), and within 50 miles by water (90%).
This report illustrates the typical weather in La Gomera, based on a statistical analysis of historical hourly weather reports and model reconstructions from January 1, 1980 to December 31, 2016.
The details of the data sources used for this report can be found on the San Sebastián de la Gomera page.
Disclaimer
The information on this site is provided as is, without any assurances as to its accuracy or suitability for any purpose. Weather data is prone to errors, outages, and other defects. We assume no responsibility for any decisions made on the basis of the content presented on this site.
We draw particular cautious attention to our reliance on the MERRA-2 model-based reconstructions for a number of important data series. While having the tremendous advantages of temporal and spatial completeness, these reconstructions: (1) are based on computer models that may have model-based errors, (2) are coarsely sampled on a 50 km grid and are therefore unable to reconstruct the local variations of many microclimates, and (3) have particular difficulty with the weather in some coastal areas, especially small islands.
We further caution that our travel scores are only as good as the data that underpin them, that weather conditions at any given location and time are unpredictable and variable, and that the definition of the scores reflects a particular set of preferences that may not agree with those of any particular reader.
Please review our full terms contained on our Terms of Service page.
La Gomera
Provincia de Santa Cruz de Tenerife, Canary Islands, Spain
La Gomera is one of the smallest and quietest islands in the Canary Island chain and remains relatively unspoiled, making it a great destination for those who want to escape mass tourism. The resort offers discerning tourists a combination of Spanish culture, history and spectacular scenery, with lush rainforests, secluded beaches and volcanic mountains providing a picturesque backdrop to your holiday.
What’s The Temperature Like In La Gomera In February
Temperature
Located south of Spain, La Gomera enjoys a mild Mediterranean climate that doesn’t vary much through the year. This means that the weather is great all year round, even in the winter. Like January, February is one of the cooler months in La Gomera but it is still temperate and warm. The island enjoys similar weather conditions, with an average temperature of 18°C during the month. The temperature can vary, reaching highs of 21°C but never dips below 14°C, so you can spend plenty of time outdoors without feeling too cold.
Sunshine Hours
February in La Gomera is much sunnier than other parts of Europe thanks to its location. An average of nine hours of sunshine warms the island each day and there’s a 52% chance of a sunny day, so you can still explore the island’s natural beauty under the heat of the sun. And if you’d like to go swimming in the Atlantic, that’s an option, too.
Sea Temperature
The sea water temperature averages around 20°C in February, which is warm enough for most people to swim.
Rain
While there is a chance of rainfall in February, it shouldn’t put too much a dampener on your visit to La Gomera. The island sees around 148mm of precipitation throughout the month with around 13 wet days and just a 12% chance of rain.
With the type of weather that you would only expect to see in the summer, the island of La Gomera makes a great winter-sun destination.
La Gomera Hotels In February
Parador de la Gomera
Considered one of the finest hotels in the town of San Sebastian, on the eastern tip of the island, the Parador de la Gomera is a luxurious yet reasonably priced hotel option. Although it is not the cheapest hotel available in the area, rates are competitive with the rest of Europe. Guests at Parador de la Gomera can relax by the pool or enjoy the ocean-side view at this resort which is located right on the coast.
Hotel Gran Rey
If you’re looking for accommodation in Valle Gran Rey, the Hotel Gran Rey is hard to beat. This three star hotel sits close to the beach, overlooking the ocean and the Gran Rey Valley, making it a great base for exploring the region. The hotel is an affordable choice but doesn’t lack in facilities, featuring a choice of traditional restaurants, two outdoor pools, sports facilities and regular evening entertainment.
La Gomera Beaches For February
With great weather all year round, visitors to La Gomera can hit the beach at any time, even in February. The island is bordered by beautiful, unspoiled black sand beaches and rugged cliffs that will delight sun worshippers and nature lovers alike.
Playa de Valle
One of the most popular areas on the island is the west, which has some of the most beautiful beaches including the long beach of Playa de Valle. This beach stretches along the delta, La Puntilla and is backed by lush green vegetation. The quiet stretch of sand is the perfect place to relax, soak up the sun or swim in the Atlantic.
Bars And Restaurants
La Forastera
La Gomera is an island for food lovers, with an array of fantastic restaurants and bars to choose from. One of the most popular with both locals and tourists is La Forastera located in San Sebastian. This small, family run restaurant serves a range of fresh and traditional Canarian cuisine with a menu full of delicious homemade tapas dishes.
Tasca Pastrana
If you’re in Playa de Santiago, don’t miss Tasca Pastrana, a gem of a restaurant located in the hilltop village of Pastrana. The menu here is varied, with a range of fabulous meat and fish dishes to suit every diner. Guests can dine on the outdoor terrace, which offers stunning views of the surrounding mountains.
El Charcon
Finally, El Charcon is a must-visit for those staying in San Sebastian. Tucked away in a quiet location next to the port, looking over the ocean to Tenerife, this restaurant make great use of its setting by serving fresh fish and seafood dishes. The mouth-watering mixed fish platter is a recommended option.
Things To Do In La Gomera In February
Carnival
While the official day may vary depending on the calendar, Carnival usually occurs during February. Truly a fabulous time to visit any Catholic nation, Carnival in La Gomera and the Canary Islands is a colourful and festive time. Locals wear costumes, conduct parades and feasts occur almost daily between the villages and cities on the island. In addition, a local will be picked to be Queen of the festivities, and there is even a tradition of burying a sardine – a fish that is central to Canarian culture.
Whale And Dolphin Watching
One of the most remarkable times for naturalists to visit the island of La Gomera is in February when whale and dolphin watching is in high season. The mammals are so prevalent in the springtime that certain companies will guarantee you will see them while out on a boat. If you plan to visit the Canary Islands for nature and relaxation, a boat trip to watch for dolphins and whales is a must.
Weather in La Gomera in February 2022. [Anomalous] Weather in February 2022
Weather in San Sebastian de la Gomera in February 2022-2021 ☁
According to our rating system, which is confirmed by the reviews of tourists who have visited Spain, the weather is excellent in San Sebastian de la Gomera in February, this month’s rating is 4.8 out of five.
Temperature in San Sebastian de la Gomera in February
Average temperature during the day:
nine0431 +19.1°C
Average temperature at night:
+17.9°C
Number of sunny days:
24 days
Rainy days: Rainfall:
nine0431 2 days 6. 8 mm
Is it worth going on holiday in February?
4
.
8
The weather is cool in the city. According to perhaps the most accurate forecast, the weather in San Sebastian de la Gomera in February is excellent, this is a very high season. In this winter month, the average ambient temperature is 19.1 during the day and about 17.9 at night. There is practically no rain, about 2 days per month, 6.8 mm of precipitation falls. Sunny weather almost the entire month for at least 24 days. The same winter weather in other cities of Aguilas, Adeje, Alicante, with a similar rating of 4.1, the air warms up to 23.0°C. According to the reviews of tourists who have visited Spain, it is worth going on vacation to San Sebastian de la Gomera in February, but in any case, we will help you decide what clothes to take. nine0003
Please note:
Weather in San Sebastian de la Gomera in January:
rating 4. 8 (out of 5),
air +19.7°C ,
rain 2 days
Weather in San Sebastian de la Gomera in March:
rating 4.8 (out of 5),
air +19.4°C ,
rain 4 days
Details
for 3 days
for the week
for 10 days
for 14 days
nine0472 for month
for the weekend
water for 14 days
for 5 days
for 7 days
2 weeks
today
tomorrow
nine0472 October
November
Air temperature
If you want to know how to dress in San Sebastian de la Gomera in February and what to wear, you can see the average data for 2018, 2019, 2020, 2021: air temperature varies from +18°C to +20 °C and is considered relatively pleasant. For example, in the previous month, the air is warmer by about 0.6°C. For comparison, next month the environment is 0.3°C warmer. At night, the temperature in San Sebastian de la Gomera in February drops to +19°C…+17°C. Temperature fluctuations between day and night are 1°C. What is the weather like in San Sebastian de la Gomera at the end of February in the beginning and middle of the month is shown on the chart, according to tourists in Spain, the situation is similar almost everywhere.
Rating, rainy days and precipitation in February and other months.
The rating in the period December – April fluctuates from 4.8 to 5.0 points. The number of rainy days in February is 2, and it ranks 1st for this indicator for the year. Precipitation is 6.8 mm, this is the 4th place among all months. At the same time, in the previous period, 4.1 mm less rainfall, in the next period, 3.2 mm less. According to the most accurate forecast from the hydrometeorological center, the hysmeteo weather in San Sebastian de la Gomera in February in the first and second half of the month (decade) is shown in the summary table for 2018, 2019, 2020, 2021 years.
In the last month of winter, many people get tired of the monotony and seek to relax. This is facilitated by the fact that in some resorts prices for entertainment and hotels are reduced. This is due to the fact that the New Year’s influx of tourists has already subsided, and the summer vacation period is still far away. At the same time, some residents of Europe and the CIS believe that in February it is not too late to chat with Santa Claus, go skiing or ice skating. And those who aspire to the beaches are waiting for tropical resorts. February is still the high season in Thailand and neighboring countries.
There are places in the world for people who can’t stand the heat well, but want to take a break from frost and snow. The resorts of North Africa and the Middle East are open for them, where it is warm during the day, but not hot. You can even swim in the sea if you are not afraid of cool water.
Traveling somewhere in February with children of school age is difficult, as it is the third quarter of the school year. An exception may be the second winter vacation, which lasts about a week, but such a vacation will not be long. But with kindergarteners and babies, you can go at least for the whole month to any resort you like. See below for details on countries and trips to them.
The best countries for holidays with a child in February!
Egypt
In February, its resorts are only 15-20 °C, and the sea water is warmed up to about 20 °C. The beaches of Egypt are not half filled with tourists, and the cost of a hotel room is 30-50% lower than in spring or autumn. With maximum comfort, a desert safari, any excursion or boat trip will take place. The number of activities by winter does not decrease, and sometimes even increases, due to the absence of suffocating heat.
In the case of Egypt, the child is less likely to have difficult acclimatization than on a trip to the tropics. Just in case, take a children’s windbreaker and sweater – it’s cool in the evening, especially when the wind blows from the desert.
Thailand
Those who are thinking where to go to the beach in February with a child, Thailand is suitable. If you are traveling with a baby under 3 years old, it is better to consult a pediatrician about acclimatization. Even in the cool season in Thai resorts it can be hotter than 30 ° C, the sea temperature practically does not differ.
There are many interesting holidays in Thailand in February. So at the beginning of the month in the city of Chiang Mai there is a festival of flowers. The streets are decorated with exotic plants, concerts and folk festivals are held. So if you find yourself in Thailand on these dates, take your child to Chiang Mai, you won’t regret it. Thailand hosts monthly full moon parties with fire shows on the beaches. But the festivities drag on into the night, so they are more suitable for families with teenagers.
Greece
Swimming in the sea in Greece in winter is not possible, but basking in the sun is easy. In addition, it is worth going to Greece with children in February to visit excursions and museums. Usually, Athens is chosen for a winter holiday, because it is in the capital that the majestic Acropolis is located. Museums are open all year round, access to attractions is open.
At the beginning of February, the Apokries festival takes place in Greece. This is an analogue of the Russian Shrovetide, but outwardly it looks more like a Brazilian carnival. Across the country, people take to the streets to light bonfires, watch parades and participate in fun carnivals.
Pick up tour
I don’t know which country I want to go to
Pick up tour
Fill out the form and our manager will contact you and advise you on any questions
Looking for the best places to visit in February? We got you covered! Whether you are seeking warm or cold weather, skiing down mountains, or sunbathing on gorgeous beaches, we share our favorite places to travel to in February.
As a pair of powder chasers, February is one of our favorite times to explore winter destinations. If it involves hot chocolate, mulled wine, lots of white fluffy snow, and big mountains you can sign us up.
That being said, February is also a great time to travel if you are seeking fewer crowds and cheaper prices. Families with children are back in school, and summer is nowhere in sight, meaning fewer people are traveling.
Here are some of the best places to visit in February.
The Best Cold Places to Visit in February
Norway
Norway is one of the best places to visit in February if you like the cold!
There’s no reason to avoid winter in Europe! It’s one of our favorite seasons for travel and a fantastic time to visit Norway where you’re almost guaranteed to see the Northern Lights and enjoy some snowy days. Norway’s dramatic landscapes and many winter activities will keep you entertained for weeks.
Nordlys over Arnøya, Skjervøy
Mush a dog sled across a frozen lake, snowshoe from mountain hut to hut, spot whales off the coast, ski down the fjord, or spend cozy days in a winter cabin.
Winter in Norway comes with plenty of charms and if your dream trip has been to see the Northern Lights there is likely no better trip in the world than to Northern Norway.
Montana
Montana is one of the best places to visit in February for ski and snowboard!
Head to Big Sky country for some excellent ski without all the crowds in Colorado, Utah, or California. There are two major ski resorts that are perfect for a week-long holiday jaunt Whitefish and Big Sky.
We’re big fans of Whitefish for some exceptional tree skiing or to find some big mountain terrain on the Lone Peak tram at the top of Big Sky.
Montana doesn’t lack in terms of natural beauty either or winter activities. Make your base in Bozeman or one of these awesome Airbnbs in Montana for some western charm and winter tours in Yellowstone with a fantastic Yellowstone itinerary.
Paris, France
Yes, it does get quite cool in Paris in February with daytime temperatures averaging 48°F but where else is better to spend Valentine’s Day with your loved one? Even if you’re flying solo, there are plenty of reasons to travel to Paris in February.
For one, there’s no worry about businesses and attractions shutting their doors and skipping town for summer vacation. Everything is open and it’s business as usual! This is also the time of year when there are fewer crowds and hotel rates are cheaper.
Cozy up in the cute little cafes, wander around the art museums and browse designer boutiques. Visit top attractions such as The Louvre Museum, the Eiffel Tower, Arc de Triomphe, the Palace of Versailles, and Musay d’Orsay.
British Columbia
For powderhounds this is one of the best places to visit in February
If you’re a powderhound, head down the Powder Highway that stretches from Central to Eastern British Columbia for some epic powder skiing in big mountain terrain. The Powder Highway is the nickname for Canada’s 95A a loop road that covers 630 miles through Southeastern Brittish Columbia. Powderhounds have everything they could want along the highway with small towns, epic ski resorts, untouched backcountry, cat skiing, alpine lodges, and heli-ski operations.
Big mountain riders are long familiar with the snowy stretch of Canada as the terrain and snow here are some of the best in the world. If you don’t have the money to shell out for the luxury providers, the seven ski resorts on the highway offer world-class skiing that rivals their helicopter counterparts.
Each resort has enough terrain and to entertain any skill level for days on end. Our personal favorites are Fernie and Revelstoke for the terrain and epic powder dumps. Check out our epic ski trip packing list!
Courchevel, France
When it comes to ski vacations, it doesn’t get much better than Courchevel, France. With temperatures hovering around 32°F and state-of-the-art snow maintenance equipment, you can bet that the slope conditions are pristine in February!
This resort area in the French Alps is considered to be the best in the region due to its extra-long ski season and for being part of the largest ski area in the world with almost 400 miles of pistes and 170 lifts.
Hop between the four villages that make up this ski area and ski some of the best slopes on earth and enjoy an après-ski scene featuring Michelin-star eateries and glitzy chalets. It doesn’t matter if you’re a seasoned skier or just learning, there’s a hill for you!
Antarctica
February means summer in Antarctica!
A trip to Antarctica is a once-in-a-lifetime experience that you’ll never forget. Few people venture to the southernmost continent because it is so cold and hard to access. Fortunately, there are guided excursions available and choosing to go in February is a safe bet for weather as the temperatures are at their warmest!
Now, you may be saying that 34°F is not very warm at all but by Antarctic standards, that’s about as warm as it’ll ever get. Remember, this is summertime in the southern hemisphere and besides, these temperatures are tolerable as long as you bundle up before heading out to see the adorable baby penguins.
February is also prime time to see whales and seals and to explore terrain that’s usually ice-covered in the much colder months. Did I mention the sun shines up to 18 hours a day this time of year? Hello gorgeous sunrises and late sunsets!
Cotswolds, United Kingdom
British winters are known for being quite dreary but there’s a place in the southwest of England that isn’t quite as dreary as the rest of the country is in the middle of February, and that’s the Cotswolds.
With an average daytime temperature of only 45°F, you’ll likely spend much of your time sipping coffee or wine around a warm fire with wintery scenes observed through frosty windows.
If you’re an outdoorsy type, you’ll enjoy exploring the scenic countryside full of hills, Iron Age ruins and picturesque manors. This region is also known for its Michelin-starred eateries, antique shops and cozy tea rooms and the prices in February are much lower than they are during peak season.
The Best Warm Places to Visit in February
Sri Lanka
Head to the vibrant island nation of Sri Lanka for a heavy dose of culture, food, beaches, jungles, and history.
February is a beautiful month to visit Sri Lana as it falls right between the country’s two rainy seasons and temperatures are warm with an average daily temperature around 27°C or 81°F. Sri Lanka is well known for its hospitable people, tasty food, and unique landscapes. Read more about the best time to visit Sri Lanka here!
Oman
Hiking in Oman / Best Places to Visit in February
If you want to escape the cold, another awesome country to check out is Oman. The Middle Eastern country on the tip of the Arabian Peninsula enchants visitors with amazing landscapes, culture, and food.
Culture permeates through Oman, and it remains authentic despite being surrounded by the grandiose dreams of its neighbors. Muscat is an enticing city with few skyscrapers, old markets, forts, and small traditional homes.
The nation has embraced its rich heritage of frankincense and trade with a wealth of natural and historical sights to be seen. Resulting in a country that’s enchanting to travel through with plenty of hidden pockets left to explore.
To make things better, the country has great infrastructure for tourists with reliable roads, plenty of hotels, tour operators, dive shops, and activities. February is an awesome time to visit Oman, but if you want to learn more read about the best time to visit Oman.
Egypt
Temple hopping in Egypt / Best Places to Travel in February
The mighty Nile has been the lifeblood of Egypt since the beginning of civilization. Along its fertile banks, surrounded by the sands of the desert, ancient Egypt prospered.
Thousands of years lure visitors in with the remains of breathtaking monuments, a rugged coastline teeming coral life, and a culture that has evolved over millennia. There are so many amazing places to visit in Egpyt.
Egypt is the gift of the Nile so there is no better way to explore than a cruise down the Nile. As you cruise down the Nile you’re transported to a time of the past. Egypt is one of the best places to travel to in February because of its near-perfect weather — comfortable warm days and cool evenings/nights.
You won’t have to wake up at the crack of dawn to beat the heat of the day either. Check out other great months to visit Egpyt in our post about the best time to visit Egpyt.
Maldives
The series of coral atolls spread across the Indian Ocean is an enticing getaway with white sand beaches, turquoise water, and tropical weather. The water here is home to an abundance of marine life so diverse that snorkelers can rejoice in close encounters with rays, sharks, whales, and a dizzying number of fishes.
To make it only better some of the world’s most luxurious resorts in the world sit on top of these atolls with indulgent water villas and beach bungalows.
February is smack dab in between monsoon seasons in the Maldives so you can expect warm weather and sunny days. Be warned, it’s also the high season as Europeans flock to escape the cold! Hotels and resorts in the Maldives can go for high prices so it’s a great time to make use of those credit card points, and book ahead.
St Lucia
At Jade Mountain in Saint Lucia
Where is the most beautiful place you have ever visited? We were asked this the other day, and as two people who have traveled to over 80 countries, I must admit it was a tough question to answer. A few places came to mind: Seychelles, Canada, and Namibia are certainly up there.
However, the tiny island nation of St Lucia packs a punch and is widely praised as the most beautiful island in the Caribbean. There are a number of resorts in St Lucia that are jewels in the Caribbean, but it’s hard to find one more unique than Jade Mountain where you’ll get neverending views of The Pitons.
Costa Rica
Costa Rica is easily one of the best places to visit in February
One of the most amazing natural destinations in the world Costa Rica is also a green powerhouse. It was the first country to go a full year on 100% renewable energy and still operate at around 99%. The country has made a clear prioritization to preserve its natural habitats with large swaths of the country protected wilderness zones or national parks.
With cheap and direct flights from the US, a plethora of wildlife, stunning coastline, and pristine jungle, it’s no wonder Costa Rica has become a hot travel destination in the last decade.
During February you can expect days upon days with no rain as it’s still the dry season. Temperatures can reach a 28°C on average. Winds tend to get stronger in February, so windsurfing fans should make a beeline to Lake Arenal – a windsurfer’s paradise.
Kauai
Of course, it’s Hawaii, so all the islands are amazing. However, the island that brings back the most beautiful memories is Kauai. I’m certain you will fall in love with the Garden Isle just as I did, but it can be hard to narrow down what to do with a short vacation.
There are so many things to do in Kauai, including a ton of free nature activities that it will be hard to ever get bored. Kauai is known for being one of the prettiest Hawaiian islands with the most laid back vibe of the four main islands.
It’s perfect for those that want to step into nature and stretch their legs on a few hiking trails. February may be the high season, but it’s due to the tremendous weather you’re guaranteed. So plan your trip to Hawaii early and book accommodation and rental cars well in advance!
Venice, Italy
Venice Carnival / Best Places to Visit in February
A simple Google search of “Venice crowds” yields photos of the mass amount of tourists that flock to Venice every summer. Having the city to yourself is one of the many advantages of traveling during the off season. Book a trip there in February and hit it right with reasonable prices and without the crowds (if booked outside of Carnival).
We always manage to visit Venice in the winter, and because of this we’ve never dealt with any of the negatives that people often complain about with Venice. The Grand Canal is a wonder of the world with centuries of architecture, grand buildings, and history literally spilling into the buzzing thoroughfare.
Visit large cathedrals, museums, and magnificent squares before dipping into charming narrow backstreets with hidden churches, bars, and churches. Also during February? The Venice Carnival, a festival world famous for its elaborate masks!
Is Venice Worth Visiting? 10 Things You Should Know
Mendoza, Argentina
It’s summer in February in Argentina so you can expect the temperatures to be a sizzling 88°F on most days. The city of Mendoza is backed by mountains which means it’s a little cooler. The scenery here is incredible with snow-capped peaks and clear, blue skies as far as the eye can see.
As the gateway to the country’s wine country, you’ll have plenty of opportunities to sample renowned Argentine wines. If you’re there in late February, check out the Vendimia Festival which celebrates the grape harvest.
Some of the top attractions include Parque General San Martín, Parque Provincial Aconcagua Potrerillos Dam and Parque de Agua Termal.
New Orleans
New Orleans is nothing short of magical. Even with its crumbling old buildings and gritty pubs, there’s an air of romance surrounding this epic American city and February happens to be one of the liveliest and craziest months to visit because that’s when the famous Mardi Gras festival takes place.
Enjoy comfortable temperatures of around 66°F as you participate in the festivities by night and explore the city’s wonders by day. Indulge in Creole cuisine and visit top attractions such as Jackson Square, the French Quarter, The National WWII Museum, St. Louis Cathedral, Mardi Gras World, Audubon Zoo and Preservation Hall.
Cartagena, Colombia
For a vibrant mix of cultures, world-class attractions and amazing weather with average temperatures of 88°F and dry conditions, Cartagena, Colombia is one of the best places to travel in February. Admire Colonial buildings, sip on rum cocktails, dine on delicious traditional dishes, dance the night away in top nightclubs, soak up the sun on stunning sandy beaches and wander city streets filled with colorful murals.
When it comes to top attractions to visit, check out Castillo de San Felipe de Barajas, Monumento Torre del Reloj, Convent of Santa Cruz de la Popa, Plaza de la Trinidad and the Palace of the Inquisition Cartagena Historical Museum.
Ibiza, Spain
Ibiza is a pretty quiet place come February
When most people think of Ibiza, they think of a non-stop party. While it’s true that the island has a reputation for being a wild nightspot, in the summer, there’s more to this island than all-night clubs and beach bashes. This is especially true in February when the crowds die down and the temperatures plunge to a comfortable 59°F.
February is also the best time to get good deals at restaurants and bars, especially on Thursdays when many businesses offer meals at half the price. When you’re not indulging in cheap food and drink, check out the historic shrines, explore the scenic countryside and visit top attractions such as Dalt Vila, Puig des Molins, Cova de Can Marca and Aquarium Cap Blanc.
Senegal
There are many reasons why Senegal, a country in western Africa, is a great place to visit in February. For one, the weather is fantastic. With temperature averaging 79°F on most days, it’s not terribly hot but certainly not cold either and rain is a rarity!
The country is known for its unique culture and lifestyle, delicious street food, vibrant arts scene and beautiful beaches that see the best conditions for surfing in February.
Venture into the pristine wilderness areas to see some local wildlife or check out some of the country’s top attractions including Gorée, Lake Retba, Village Des Arts and Mosque of the Divinity.
Chile
In February, it’s late summer in Chile but it doesn’t get so hot that it’s unbearable. The average daily temperature in the country this time of year is 68°F which means it’s warm enough in many areas to hit the beaches but cool enough to explore the many attractions and participate in some outdoor adventures.
Chile is a land of contrast and beauty. Think majestic mountains, sprawling deserts, sparkling glacial lakes and volcanoes. It is said that the night sky in the higher elevation areas of the country is the clearest anywhere in the world so it’s no surprise that stargazing is a popular activity after the sun goes down.
The nightlife of Santiago is second to none for those who prefer a more lively nighttime outing! If you love wine, Chile is known for its red wines that can be enjoyed in many venues around the country.
Some of the top attractions include Torres del Paine National Park, Valle de la Luna, Cape Horn, Mylodon Cave Natural Monument and Humberstone and Santa Laura Saltpeter Works.
Kerala, India
When it comes to the most-sought destinations to visit in India, Kerala is among the top choices especially in February. The temperatures are still quite hot, rain is virtually non-existent and the crowds have thinned out to reveal a peaceful, laid-back place where you can just lie on the beach all day and dine slowly on local culinary delights in the fantastic restaurants.
There are many fascinating attractions in Kerala including the Dutch canals of Cochin, Eravikulam National Park, Sree Padmanabhaswamy Temple, Athirappilly Water Falls, Silent Valley National Park, Edakkal Caves and Mattancherry Palace.
Bahamas
Of course, no list of places to travel in February would be complete without mentioning another place in the Caribbean! I mean, who isn’t dreaming of a tropical getaway away from the cold and snow to escape to a place where the air is a perfect 77°F, the water is warm and crystal clear and rain is almost non-existent?
This is what it’s like in the Bahamas in February! One of the top reasons why February is the best time to visit is fewer crowds. The Christmas rush is over and the rowdy spring breakers haven’t arrived yet so you’ll have the white, sandy beaches and attractions almost all to yourself.
Enjoy a laid-back atmosphere where time seems to stand still, wander historic streets, sip on a cocktail at sunset and visit top attractions such as Atlantis Bahamas hotel and casino, Lucayan National Park and Garden of the Groves.
Bahia, Brazil
Late February is carnival time in Brazil but with temperatures hovering around 88°F, any time of the month is perfect for a visit to the vibrant Bahia region of the country.
Wind down from a big night of partying with a relaxing day on a sandy beach where you can float in warm waters or immerse in the vibrant afro-Brazilian culture and perhaps brush up on your samba skills.
There are many attractions to explore too. Check out Pelourinho Catedral Basílica, Casa do Rio Vermelho, Mucugê Waterfall, Barra Lighthouse and Morro de São Paulo.
Plan For Your Trip
Protect Your Trip: We don’t travel without travel insurance, nor should you. You never know what can happen while traveling, so it’s best to be prepared. HeyMondo provides excellent short-term and long-term travel insurance plans.
Find Cheap Flights: Sign up for Scotts Cheap Flights to get notified when prices get ultra low.
Travel Adapter: Make sure you find a good adapter to keep your personal electronics charged. Otherwise, you may be paying for a cheap one once you land. Purchase one here.
Travel Backpack: We like the Nomatic Travel Backpack for our travels. Check the price here.
Our Favorite Travel Shoes: Our answer to this question is always ALLBIRDS! Check them out on their site!
Get a Travel Credit Card: We travel worldwide for free because we have leveraged our spending into points. See why you should get a travel credit card andhow you can do the same with our favorite travel credit cards.
Now that you know the best places to visit in February let’s explore more!
The Best Places to Visit in January
The Best Places to Visit in March
The Best Places to Visit in April
The Best Places to Visit in May
The Best Places to Visit in June
The Best Places to Visit in July
The Best Places to Visit in August
The Best Places to Visit in September
The Best Places to Visit in October
The Best Places to Visit in November
The Best Places to Visit in December
Sicily in February: Travel Tips, Weather, and More
Weather
February sees little difference compared to January in Sicily, with averaging temperatures ranging between 42-54°F (5-12°C) across the island and 48-59°F (9-15°C) in Palermo, though the seasonal rains continue to lessen. The climate along the coasts will be warmer than inland, seeing a little more rain too, while the hilly interior sees colder weather, like in Prizzi, with an average range of 36-46°F (2-8°C). Higher altitudes (think Mount Etna) will be colder yet with its snow-laden sides inviting the skiing crowds to its resorts.
And if the winds from the Balkan Peninsula are present, temperatures along the coast can temporarily drop to freezing. With that said, however, it’s not entirely unheard of to head to the beach to relax under the temperamental sun. You’ll just want to avoid the water (59°F/15°C).
Crowds & Costs
Still considered offseason, February is a great time to visit Sicily. There are next to no crowds, granting you an all-access pass to seaside views unhindered by tourists and selfie sticks. Expect rock-bottom prices on accommodation, car rentals, and airfare. It’s important to note, though, that many hotels, restaurants, and attractions are closed in resorts and smaller towns that depend on tourists, like Erice and San Vito Lo Capo. Meanwhile, ferries operate on a reduced schedule.
Skiing is popular in February with locals heading to the slopes of the Madonie mountains and Mount Etna. That said, their runs are uncrowded, and passes are inexpensive, especially in comparison to other popular ski destinations in Italy. Similar to other southern European countries, Sicilians practice the art of siesta year-round: businesses are likely to be closed between 1:30 pm to 4:30 pm, daily.
If you’re coming to the island during Carnival and St. Agatha’s Feast Day in Catania, it’s worth booking accommodation and reservations ahead of time.
Where to Go
If you happen to be in Sicily during Italy’s version of Carnivale, you’ll find plenty of celebrations all over the island with many lasting for days on end. You’ll want to venture to Acireale, a town north of Catania between Mount Etna and the sea, for one of the country’s most famous pre-Lent celebrations. Expect to see massive allegorical floats, costumed participants, and giant papier-mâché caricatures of famous people. Other options that put on a good show are the sophisticated resort town of Taormina on the Ionian Sea and Sciacca, the historic fishing port in the northwest—its origins date back to the days of the Roman Empire.
Meanwhile, at the beginning of the month, Catania celebrates one of the world’s largest festivals, the Festa di Sant’Agata (Feast of St. Agatha). With crowds up to 1,000,000 devotees flocking to the city to pay their respects and participate in the festivities honoring the martyred woman (processions, choirs, food, and fireworks).
Sicily might not be known for skiing like its northern Italian counterparts, but the region does boast three resorts offering runs of varying degrees of difficulty with ideal conditions: mild weather, few crowds, inexpensive passes. Take advantage of the novelty of skiing on an active volcano and head to one of two resorts on Mount Etna, Nicolosi on the southern side and Linguaglossa on the northern. And if the conditions aren’t favorable (lack of snow or volcanic activity), get yourself to the south coast for the Agrigento Almond Blossom Festival and a possible lie out on the beach.
What to Do
February is a great off-season month to be flexible and experience local life. With few competing tourists, take advantage of the available house rentals or agriturismo listings and spend a few days on a farm and enjoy living like a local (renting a car is your best option for this experience).
You might find better service in hotels and restaurants, too, so make friends with your waiter and dine unhurried savoring local and seasonal fare, like sea urchins and freshly baked pasta reale (almond marzipan pastries in honor of the blossoming almond trees).
And while the weather still holds a chill keeping the foreign visitors at bay, explore Sicily’s vast wealth of archaeological and historical sites and medieval and baroque city centers. Visit the Valley of the Temples in Agrigento, the 5th century BCE Greek theater in Syracuse’s Neapolis Archaeological Park, and wander the narrow and winding streets of Ragusa Ibla, Modica, and Scicli for their excellent examples of the Sicilian Baroque style of architecture.
Fans of the arts might like to know opera season kicks off this month with a handful of premium theaters hosting important works. Teatro Massimo in Palermo is such a theater to consider (and Italy’s largest). And if you find yourself in the regional capital, travel down the western coast to the salt flats of Trapani to walk amid the dazzling checkerboard of saltwater basins, particularly stunning during sunset.
Events
Carnevale. Held annually 40 days before Easter on the liturgical calendar, Italy’s Carnival celebrations occur sometime between January and April but often fall in February. This is the biggest event of the month by far, with celebrations in cities and towns throughout the country.
St. Agatha’s Feast Day. Beginning on February 4 in Catania, locals spend a week celebrating Saint Agatha, a martyr who died in the 3rd century. A procession follows a silver carriage housing her relics up Monte Sangiuliano, and there is quite a bit of merrymaking and fireworks. The event is regarded as one of the largest religious processions in the world.
Almond Blossom Festival. Agrigento holds this weeklong festival from the first Sunday through the second Sunday of the month. Traditional Sicilian sweets made with almonds are served, and the event is held in tandem with an international folklore festival, so there’s a lot of live music, parades of people in historical costumes, shows, craft exhibits, and fireworks.
Traveling to Sicily in February? Check out these great itineraries.
7 Days in Sicily: Mount Etna, the Ionian Coast, and Cefalú. Travelers who don’t mind a bit of rain will have the highlights of Sicily all to themselves in February: Europe’s largest volcano, ancient archeological sites, shimmering turquoise waters, and easy to navigate resort towns alike.
Southeast Sicily in 7 Days: Syracuse and the Valley of the Temples. The southeastern coast of Sicily will be a bit warmer than inland regions in February.
Written By
Scarlett Murray
on ·
15th November 2022
· Article, Buying Guides, Lifestyle
Lovers of warmth, lovers of thrill, lovers of beaches – your new home is beckoning. Tenerife, the largest and most populous Canary Island, is a destination that boasts of excitement all year round.
There’s so much in Tenerife to adore
Tenerife is the perfect home for outsdoorsy types looking for their move overseas to be a new lease of life. From glorious weather to water sports to impressive landscapes, we’ll explore all that there is to draw you in to Tenerife.
Walkers and nature enthusiasts, why not have the highest peak in Spain be your go-to location for a leg stretch?
Unbelievably scenic
Mount Tiede.
Visually, Tenerife is a never-ending treat. Most famously, it is home to the Teide, the highest peak in Spain and a world heritage site. The Teide volcano is 3,715 metres tall. It offers generous views of lava cones, flows, and rocks. Impressively, some of the fauna and flora in the Teide National Park are exclusive to the area.
Excitingly, in six hours, you can actually climb the Teide.
So, walkers and nature enthusiasts, who have trailed the same trail in the UK over and over – why not mix it up completely and have the highest peak in Spain be your go-to location for a leg stretch?
Find homes in Tenerife via our property portal.
Anaga Rural Park.
Tenerife’s offers of visual delights are not limited to the Teide. Discover the UNSECO Biosphere Reserve of Anaga Rural Park. It encompasses the largest Laurel Forest. It was formed by a volcanic eruption 7 to 9 million years ago, making it the oldest part of Tenerife. Anaga Rural Park is worth more than a day trip – or even a couple of visits in a holiday – for there is so much to see and do. There, you can hike through subtropical forests, swim in natural pools, and visit caves. Biologists and photographers, aren’t you fascinated?
Stargazers, it’s rare that there’s a location that is specifically for you. With pollution so present in many of our skies, it can be hard to find a spot. But Tenerife is known for its clear skies and there’s an abundance of star-gazing tours. But if you are already comfortable with a telescope, then Tenerife could be the ideal place for you to explore that interest further, uninterrupted by polluted skies.
The fabulous weather means that you get to take advantage of all that Tenerife has to offer all-year round.
Cities
Tenerife carnival.
La Laguna
You can also wile away your days in La Laguna. The old town is a UNSECO world heritage site. It was the first city established in the Canary Islands, with architecture dating back to the 15th century. In the new town, you can find plenty of bars, restaurants, and shops.
Santa de Cruz
The capital of Tenerife, Santa de Cruz is a lively city. It is known for its annual carnival: a fifteen-day spectacular of joy with parades, a Carnival Queen, and live music galore. Outside of the carnival, Santa de Cruz is bustling, modern city with all you could need and want to fill your time.
Beaches
Discover Tenerife’s beaches.
Tenerife is home to gorgeous beaches. Beaches gorgeous enough to make you want to move there, even without the added lure of volcanos and vibrant cities. Many beaches in Tenerife are geared towards tourists. So, you’ll have plenty of restaurants, ice creams, and lifeguards on duty. Furthermore, Tenerife offers action-packed time in the water. You can go on the lookout for whales and dolphins, scuba-dive, snorkel with turtles, surf, kayak, and more. Tenerife is really the best place for people who like to be on the move. People who are curious. People who like to feel their heart thumping excitedly.
Children
Tenerife is a wonderful place to be a child in!
Maybe you are moving to Tenerife as a family. Or you are looking for an action-packed retirement and are hoping that the grandkids will happily join you over half term. As well as being able to offer kids warm, fun filled days at the beach and in nature parks (hey, you may even be able to tear your child away from their screen with walking up a volcano), there are amusement parks too. There’s Siam Park, a popular water park; Aqualand; Loro Parque, a world-famous animal adventure park; and the Submarine Safari.
Weather
A place of visual delights!
Perhaps the greatest thing about Tenerife is the weather. Lots of places around the world have amusement parks to keep your kids endlessly entertained. Lots of places have a plethora of nature to observe and enjoy. Although, it could be said that Tenerife has an enviable combination of things to experience.
However, many locations have the drawback of seasonal changes really altering how much you can appreciate the place. The UK, for example, has so much nature and history to see – but for so many months of the year, exploring means getting rained on and feeling cold. It can be off-putting.
Meanwhile, Tenerife experiences warm summers and mild winters.
The coldest and wettest month is January, with an average daily maximum of 21 degrees. It sees around 41mm of rainfall. But this rain tends to appear in short bursts, enabling you to glow in sunny, dry days most of the time. Rain is most likely from November to February.
By April, temperatures climb to the mid-twenties and steadily increase, peaking in August, at 30 degrees.
Weather is different in the north and the south. With the north experiencing wetter, potentially cooler temperatures – but still, far warmer than the UK and other parts of Spain!
One thing to be aware of are “calmia” – these are dust storms that come from the Sahara. During these times, it is best to stay indoors.
This fabulous weather means that you get to take advantage of all that Tenerife has to offer all-year round.
Tenerife for holiday rentals
Plus, if you are thinking of renting your property out as a holiday home, Tenerife is a great place to do that. You can rent out during August, the peak holiday season. And then enjoy your property for the other eleven months of the year, in weather that is mostly marginally cooler than the peak season. It is such a great set-up, it sounds like a trick – honestly, it’s not.
Move to Tenerife & befriend the dolphins.
Distance
Second to the weather, the greatest benefit of Tenerife is its distance from the UK. For other locations that offer all the all-year round pleasant climate and advantages of Tenerife, you’d have to look outside of Europe. But you may not feel comfortable doing that. Tenerife is a fantastic option for people who want to be able to pop back to the UK with ease. Flight time is between four and five hours. Flights from major UK airports to Tenerife are daily, even during the off season. Although, prices really do change when you chose to fly at popular times.
Properties
I’m not sure which part exactly had you – it might’ve been the water sports, Santa de Cruz, the scenery –you’ve fallen for Tenerife. But how much exactly would it cost to call home?
In our property portal, we have over 400 homes to-be in Tenerife. Recently, I wrote an article on 10 homes that benefit from the winter sun, it features properties in Tenerife and the other Canary Islands – ready to whet your appetite.
If it’s just one or two of you looking to make the move, then your starting price for a one-bedroom apartment would be about €150,000. This price would grant you access to a communal swimming pool and enable you to be walking distance from the beach.
Alternatively, if you are looking for a property that your whole family could move into, then the starting figure for a four-bedroom would be just under €300,000.
If you would like more advice on moving to Spain, then download our guide here.
Tenerife weather on February 10 in detail, weather forecast for February 10, Tenerife, Canary Islands (Spain)
Tenerife weather on February 10 in detail, weather forecast for February 10, Tenerife, Canary Islands (Spain) – Rambler / weather
Mail
News
Cinema
Sports
Auto
show business
horoscopes
Finance
Work
Post
News
Cinema
Sports
Auto
show business
Horoscopes
Finance
Work
MIR
Canary Islands (Spain)
Tenerife
Weather in Tenerife on February 10, 20000
Thor
9004,
10 9000 9004 9004 9004 9004 9000 9004 900 February
25 °
is felt as 23,
°
is felt as 23 °
Wind 4 m/s
Pressure 766 mm
Sunrise 07:47
Sunset 18:51
Svet day 9 min 9 min 9 min. 0003 arrival Moon
UV-index 5
Calm Magnetic Polard Gardener
00:00
03:00
06:00
12:00
:00 15:00 p.m. : 00
11:00
All cities
World
LondonParisNew YorkDubaiKievMinsk
Resorts
SochiAntalyaSimferopolBarcelonaRiminiRhodos
All countries
Thanks to our weather service, you will always be aware of what the weather will be like in Tenerife on February 20th. Tenerife on February 10, 2022, which added data on temperature, humidity, maximum wind speed and data on other weather phenomena. For those users who like to plan their time in advance and be independent of the weather, the site offers an extended daily forecast that reflects all changes in the weather every 3 hours. The extended view of the display may be of interest to those who are forced to travel or have to stay outside for a long time. For those who do not need detailed weather, you can switch to the normal weather display mode. The weather forecast for the long term is indicative and is formed on the basis of weather data for similar dates in previous years.
GISMETEO: The Canary Islands were covered by a wave of cold, in some places the temperature dropped to -12 °С – Climate
Switch to mobile version
Climate
In the Canary Islands on Friday, February 5, two of the lowest temperatures in Spain were recorded in a day. Temperatures dropped to -3.7°C on Mount Teide, and temperatures dropped to -3.7°C on Mount Roque de los Muchachos, according to the State Meteorological Agency of Spain ( Aemet ).
Los radiómetros y fotómetros en el exterior permanecen “en modo de reposo” y totalmente cubiertos ya de hielo La cencellada no ha sido, por ahora, importante.
Lanzarote is a winter-sun destination, and so you’ll find February is pleasantly warm. It’s an ideal month for hiking – not too warm with clear skies and little rain. The sea is warmer than you might expect for February and is comfortable for swimming. We’ve looked at the most up-to-date weather data for Lanzarote, covering the last 12 years up to 2022, plus we’ve asked our team of travel bloggers for their first-hand experiences in order to answer the most frequently asked questions about Lanzarote weather in February.
What’s the weather like in Lanzarote in February?
The weather in Lanzarote in February is mostly sunny, like the rest of the year on the island! The southern part of the island, in particular, has minimal rainfall and plenty of sunshine, making it a great place to visit from the UK for some winter sunshine. Daytimes have temperatures reaching from 18 to 22 degrees Celsius on the warmest days in February, and dropping to around 13 degrees during nighttime. It’s not dissimilar to a warm spring in the UK as cloud cover and wind can make you feel cold and reach for a light cardigan, but the calm and uninterrupted blue skies make for perfect sunbathing weather!
Answered by Travel Vixta
What should I pack for a holiday in Lanzarote in February?
Most daytimes in Lanzarote in February are perfectly warm enough for beachwear. Think shorts and t-shirts, dresses and flip flops for the daytime. Take a light cardigan for windy days and a light raincoat in case you’re unlucky and catch one of their two days of rainfall for the month!
If your hotel pool is heated then you’ll definitely want your swimwear, but if not then the pools are pretty cold in February! The same for the sea.
Nighttimes are noticeably cooler, so you may prefer jeans or trousers for the evenings and light jackets in case of breezes. February in Lanzarote is not dissimilar to a warm spring in the UK where you can start to wear summer clothes in the daytime when the sun is out, but you need a cardigan or something warmer to put on for cloudy days or when the sun disappears in the evening.
Answered by Travel Vixta
What’s great about Lanzarote in February?
One of the best things about visiting Lanzarote in February is being out of the summer season, it is relatively quiet! I say relatively as it’s still a popular spot for UK tourists to get some winter sun, being so close, and there is a school half term in February so this will be a busier week. You can also get much better prices for hotels and package holidays in February compared to the summer months, so it’s a great time to visit if you’re on a budget. The flight is around four hours long, making it a relatively quick destination to get to for some winter sun. February is often the coldest month in the UK with average temperatures of 7 degrees, so stepping off a plane in Lanzarote in 18-20 degree weather feels amazing! Like stepping right into spring or summer!
Answered by Travel Vixta
What’s the temperature like in Lanzarote during February?
February is typically the coolest month in Lanzarote. The temperature reaches around 18℃ during the daytime, falling away to 16℃ at night. The UV index will be moderate at this time of year, so not something to worry about for the average person. However, if you’re going to be outside for long periods it’s worth wearing a broad spectrum SPF 30+ sunscreen and UV-blocking sunglasses. Remember that bright surfaces, such as water and sand increase UV exposure.
Does it rain in Lanzarote during February?
On average, in you’ll see rain on just one day in the month. In other words, you shouldn’t see any of the wet stuff. You’re not likely to see a thunderstorm during your trip.
How warm is the sea in Lanzarote during February?
The water around Lanzarote is around 18℃ during February. It will feel a little on the cool when first entering, but you’ll warm up quickly. Most kids will have no problem with this temperature, but those who feel the cold are unlikely to want to swim.
Things to do in Lanzarote
See more
Weather in Lanzarote
Our month-by-month guide to the weather and climate in Lanzarote
Lanzarote weather in
January
Lanzarote weather in
February
Lanzarote weather in
March
Lanzarote weather in
April
Lanzarote weather in
May
Lanzarote weather in
June
Lanzarote weather in
July
Lanzarote weather in
August
Lanzarote weather in
September
Lanzarote weather in
October
Lanzarote weather in
November
Lanzarote weather in
December
Climate and Weather – Weather in Lanzarote in February
Is February a good time to visit Lanzarote
Dry and mild, with plenty of sunshine, February may well prove to be a comfortable winter sun month to choose a holiday in Lanzarote, but, be warned, this is the second coolest month in Lanzarote and there is the threat of dust storms which could be very unpleasant from mid-February onwards. The dust storms come from the African mainland, and are very unpredictable. It’s a gamble – you may not experience one during your holiday in Lanzarote, but if you do, be prepared to sacrifice a day or two to this weather phenomenon. For the most part, however, February in Lanzarote offers warm weather during the day, chilly nights, and the lottery of nasty dust storms!
Climate in Lanzarote in February
It is difficult to promise perfect weather in Lanzarote in February – not because there is not enough sunshine or warm temperatures, but because of the unpredictable threat of horrid dust storms! Even though it is one of the coolest months of the year, daytime temperatures normally hover around a comfortable 21°C in Lanzarote in February, with averages of a degree or two warmer in the southern and western coastal resorts. Nights can be rather chilly though, with an average of 13°C. The sun shines radiantly on Lanzarote most days during February, for an average of eight hours a day, barring the odd passing cold front that may bring a shower or two.
The most unpleasant aspect of the weather in Lanzarote during February, however, is the periodic invasion of dust clouds from Saharan Africa, accompanied by dry heat waves when the temperature can spike to 30°C or thereabouts.
What’s on in Lanzarote in February
In true Latin style, February is Carnival month in Lanzarote, with festivities taking place across the island over several days. The capital, Arrecife, leads the carnival charge with it processions and live music events, around mid-month, followed by Puerto del Carmen, Costa Tguise and Playa Blanca. If you time it right you can party through carnivals from mid-February right through to early March in Lanzarote.
What to pack for a holiday in Lanzarote in February
Summer gear, including your swimwear, will do good service in Lanzarote in February, but if you plan to be out and about after dark make sure you have a warm jumper and perhaps a light coat, to counter the evening chill. The daytime heat is dry, and the sun intense, so moisturiser and sunblock are essentials.
Related Content:
Weather in Lanzarote in December
Weather in Lanzarote in November
Weather in Lanzarote in October
Weather in Lanzarote in September
Weather in Lanzarote in August
Weather in Lanzarote in July
Weather in Lanzarote in June
Weather in Lanzarote in May
Weather in Lanzarote in April
Weather in Lanzarote in March
Weather in Lanzarote in January
Weather in Ibiza in October
Weather in Ibiza in September
Weather in Ibiza in August
Weather in Ibiza in July
Weather in Ibiza in June
Weather in Ibiza in May
Weather in Ibiza in April
Weather in Mallorca in October
Weather in Mallorca in September
Weather in Mallorca in August
Weather in Mallorca in July
Weather in Mallorca in June
Weather in Mallorca in May
Weather in Mallorca in April
Weather in Lanzarote in February.
Sea water temperature.
Average day temperature:
18.8°C
Average temperature at night:
16.5°C
Sea temperature:
18.2°C
Number of sunny days:
14 days
Day length:
10.8 – 11.5 hours
Number of rainy days:
1 day
Rainfall:
13.5 mm
Air temperature in Lanzarote in February, °С
Data for:
2022
2021
2020
2019
For the current year, we display on the chart both information for the past days and a forecast for the near future. The forecast is displayed as a dotted line.
Water temperature in Lanzarote in February, °С
Data for:
2022
2021
2020
2019
The graph shows the sea water temperature in February 2022. For the current year, we display the actual water temperature values for the past days and the predicted temperature for the near future. The forecast is displayed on the chart as a dotted line.
Sunny, cloudy and overcast days
The chart above shows the average number of clear, cloudy and overcast days in a month, based on data collected over the past 5 years.
Monthly precipitation, mm
This chart displays the amount of rainfall in a given month and will help you estimate the likelihood and intensity of rain in Lanzarote in any given month.
Average wind speed, m/s
This chart shows the average wind strength for each month. With it, you can determine the windiest and calmest months of the year.
Average hours of sunshine per day
This chart shows the average number of hours per day that the sun’s rays reach the earth’s surface. This indicator is affected by both the length of daylight hours and cloud cover. For calculations, we used the daily cloudiness indicators for the last 5 years.
Monthly weather in Lanzarote
January
April
July
October
February
May
August
November
March
June
September
December
Climate and weather of the Canary Islands
Where are the best places on Earth? You can see them not only on the map, but also personally go there. Mild climatic zones and eternal spring is the dream of many, which is embodied in the Canary Islands. The weather here is unique, at any time of the year the temperature remains at a positive level. In the lagoons, the water is always suitable for swimming, and the sun’s rays gently caress the skin without leaving burns.
The average temperature in the Canary Islands is +22 degrees. You can forget about minus and frosty winters, so if you want to plunge into the ocean when a snowstorm is raging in the country, it will be warm and real spring in Tenerife.
The ideal time when Spain attracts tourists is May and October. The water in the ocean is well warmed up, the sun will not be covered by clouds, and you can relax and unwind on the beach. A small rainy season occurs in winter, but it ends in less than a week.
Monthly temperature in the Canary Islands
If you want to travel to the Canary Islands, check the approximate weather by month. In January, the rainy season begins, but the air temperature does not drop below +23 degrees. In February, it is a little cooler – up to +20 degrees Celsius.
Spring pleases visitors with warmth and constant sunshine. In March, the beloved resort of Tenerife remains +21 degrees, in April – +22 °C. In spring you can plunge into the warm ocean, which has warmed up – the water temperature reaches +18 degrees. .
May is the beginning of the holiday season. It gets even warmer outside (up to +24 degrees), and the ocean beckons with its purity. You can go to Fuerteventura and try your hand at surfing.
During the summer months, the streets are full of tourists. And this is not surprising, because the temperature rises to +26 degrees in June, and in July you can enjoy the beginning of the heat – the thermometer readings reach +28 °C. The real African summer begins in August. In summer, the air temperature in the shade is up to +33 degrees, but if you go to Tenerife, you can find yourself in a cooler place (+29°C).
In autumn the heat is not so noticeable:
September – up to 28 degrees Celsius;
October – about 26°С, precipitation is possible;
November – up to 22 degrees with a plus mark.
Also comfortable temperature will be in December. In winter, there are fewer tourists, so it is possible to enjoy your vacation at a loyal price.
Climatic zones
The Canaries are close to Africa, but the climate and weather of the Canary Islands are different. The climate here is mostly tropical. Little rain, always very warm. If you prefer to rest in a specific part of the archipelago, you should familiarize yourself with the climate in a particular area.
Holidays on the highest islands will be especially pleasant. You can climb the slopes of volcanoes, enjoying the coolness. Although at the foot it is always warm. And on the peaks, even in the warm season, there will be snow. The east of the archipelago has a drier climate. The wind that blows from the Sahara makes the weather less humid. And in the southern islands, the main influence on the climate is exerted by the Atlantic Ocean.
The most popular holiday destination is Tenerife. Spring all year round pleases locals and visitors. The temperature changes within seven degrees. No less pleasant climatic conditions on the island of Gran Canaria.
Weather Forecast for Tenerife from 7th February to 13th February |
February 7, 2011
Jack
Recent News, Weather
The Weather in Tenerife 31st January to 6th February
AEMet got their predictions more or less right for last week with lots of sun in the south of Tenerife and the north getting off to a cloudy first half of the week but had a beautiful second half. It did snow again on Mount Teide at the beginning of the week, but by the end of the week a lot of the snow on the crater floor had gone.
The Weather in Tenerife 7th February to 13th February
It should be quite typical February weather for the coming week according to the Spanish Met Office. Lots of sunshine, temperatures hovering around the 21C mark and a good chance of some rain during the second half of the week – a definite on Wednesday. Forecasters are predicting calima for the start of the week, but as predicted temperatures aren’t rising, it should be a weak one. It also looks as though next Saturday could be pretty windy across Tenerife so we’ll be keeping an eye on that situation. Weather in South Tenerife – Sunny Monday, cloudy with sun on Tuesday then sun and rain from Wednesday to Friday and a mix of cloud and sun for the weekend. Whilst rain should be a definite on Wednesday there’s between a 25 and 50% chance of rain from Thursday to Sunday. Temperatures should be around 21C.
Weather in North Tenerife – Sunny Monday, cloudy with sun on Tuesday then sun and rain from Wednesday to Friday and a mix of sun and cloud for the weekend. Whilst rain should be a definite on Wednesday there’s between a 45 and 65% chance of rain from Thursday to Sunday. Temperatures should be around 21C.
Weather in East Tenerife – Sunny Monday, cloudy with sun on Tuesday then sun and rain from Wednesday to Friday. Cloud and sun on Saturday and sun and rain on Sunday. Whilst rain should be a definite on Wednesday there’s between a 45 and 65% chance of rain from Thursday to Sunday. Temperatures should be around 21C.
Weather in South West Tenerife – Sunny Monday, cloudy with sun on Tuesday then sun and rain from Wednesday to Friday and a mix of cloud and sun for the weekend. Whilst rain should be a definite on Wednesday there’s between a 25 and 45% chance of rain from Thursday to Sunday. This is the area with the best chance of staying dry all Thursday. Temperatures should be around 21C.
Weather in the Mount Teide Crater –Sunny all week in the crater except for Wednesday when even the crater should see some rain. Temperatures will be around a cool 7C. Same as the crater except that on Wednesday there should be more snowfall on Mount Teide and temperatures will plummet to -8C. The rest of the week they’ll vary from -1 to -4C.
At this moment the cable car is operating normally.
So far today the stunning weekend weather continues and it’s blue skies and sunshine across and Mount Teide is looking as pretty as a picture.
Pic: The Observatories at Izaña in Teide National Park in snow
Jack is co-editor, writer and photographer for BuzzTrips and the Real Tenerife series of travel websites as well as a contributor to online travel sites and travel magazines. Follow Jack on Google+
Website
Related Articles
Weather in Santa Cruz de Tenerife in February 2023
What are the holidays like in Santa Cruz de Tenerife in February? What is the air temperature, is there a chance of rain and is it possible to swim? Santa Cruz de Tenerife in February – read on the Tour Calendar!
Contents
What is the weather like in Santa Cruz de Tenerife in February? The February temperature in the city rises to +18.2 degrees during the day, +15.2 degrees at night. February – almost no rain. The water temperature in February drops to +18.6 degrees.
Average temperature
+17°
Air temperature during the day
+18°
Air temperature at night
+15°
Water temperature
+19°
Rainfall (mm)
29mm
Rain
2 days
Sunny days
13 days
Humidity
45%
Day length
11 hours
All months March >
Air temperature in Santa Cruz de Tenerife in February
The air temperature in February in Santa Cruz de Tenerife during the day is +18 °C, at night: +15 °C. The highest value for February in the afternoon was noted on February 25, 2020 and amounted to +30 °C, the lowest on February 20, 2022: +13 °C.
Sea temperature in Santa Cruz de Tenerife in February
The water temperature in Santa Cruz de Tenerife in February averages around +19°C, which is hardly suitable for swimming. The highest value for February was recorded on 02/01/2016 and equaled +20 °C, the lowest on 02/28/2022: +17 °C.
How many sunny days per month
There are 13 sunny, 6 cloudy and 10 cloudy days per month, so the weather in Santa Cruz de Tenerife in February is quite friendly.
Santa Cruz de Tenerife in February Things to do?
Tour-Calendar assessed the possibility of types of recreation on a scale from 0 to 5 .
Beach holidays
3
Excursions
5
Bicycle
5
Sport
5
Weather archive in Santa Cruz de Tenerife for February
Look at the weather in Santa Cruz de Tenerife in recent years in February days.
Costa del Sol February Weather, Average Temperature (Spain)
Daily high temperatures increase by 2°F, from 62°F to 64°F, rarely falling below 57°F or exceeding 71°F.
Daily low temperatures increase by 2°F, from 46°F to 48°F, rarely falling below 39°F or exceeding 55°F.
For reference, on August 5, the hottest day of the year, temperatures in Costa del Sol typically range from 70°F to 87°F, while on January 22, the coldest day of the year, they range from 46°F to 61°F.
Average High and Low Temperature in February in Costa del SolFeb112233445566778899101011111212131314141515161617171818191920202121222223232424252526262727282840°F40°F45°F45°F50°F50°F55°F55°F60°F60°F65°F65°F70°F70°F75°F75°FJanMarFeb 162°FFeb 162°F46°F46°FFeb 2864°FFeb 2864°F48°F48°FFeb 1163°FFeb 1163°F47°F47°F
The daily average high (red line) and low (blue line) temperature, with 25th to 75th and 10th to 90th percentile bands. The thin dotted lines are the corresponding average perceived temperatures.
The figure below shows you a compact characterization of the hourly average temperatures for the quarter of the year centered on February. The horizontal axis is the day, the vertical axis is the hour of the day, and the color is the average temperature for that hour and day.
Average Hourly Temperature in February in Costa del Sol
Average Hourly Temperature in February in Costa del SolFeb112233445566778899101011111212131314141515161617171818191920202121222223232424252526262727282812 AM12 AM2 AM2 AM4 AM4 AM6 AM6 AM8 AM8 AM10 AM10 AM12 PM12 PM2 PM2 PM4 PM4 PM6 PM6 PM8 PM8 PM10 PM10 PM12 AM12 AMJanMarcoldcoldcoolcoolcomfortable
frigid 15°F freezing 32°F very cold 45°F cold 55°F cool 65°F comfortable 75°F warm 85°F hot 95°F sweltering
The average hourly temperature, color coded into bands. The shaded overlays indicate night and civil twilight.
The month of February in Costa del Sol experiences essentially constant cloud cover, with the percentage of time that the sky is overcast or mostly cloudy remaining about 37% throughout the month. The lowest chance of overcast or mostly cloudy conditions is 36% on February 12.
The clearest day of the month is February 12, with clear, mostly clear, or partly cloudy conditions 64% of the time.
For reference, on October 30, the cloudiest day of the year, the chance of overcast or mostly cloudy conditions is 45%, while on July 20, the clearest day of the year, the chance of clear, mostly clear, or partly cloudy skies is 94%.
Cloud Cover Categories in February in Costa del Sol
Cloud Cover Categories in February in Costa del SolFeb11223344556677889910101111121213131414151516161717181819192020212122222323242425252626272728280%100%10%90%20%80%30%70%40%60%50%50%60%40%70%30%80%20%90%10%100%0%JanMarOct 3055%Oct 3055%Feb 164%Feb 164%Feb 2862%Feb 2862%Feb 1164%Feb 1164%clearmostly clearpartly cloudymostly cloudyovercast
The percentage of time spent in each cloud cover band, categorized by the percentage of the sky covered by clouds.
A wet day is one with at least 0.04 inches of liquid or liquid-equivalent precipitation. In Costa del Sol, the chance of a wet day over the course of February is essentially constant, remaining around 19% throughout.
For reference, the year’s highest daily chance of a wet day is 22% on November 17, and its lowest chance is 0% on July 29.
Probability of Precipitation in February in Costa del Sol
Probability of Precipitation in February in Costa del SolFeb11223344556677889910101111121213131414151516161717181819192020212122222323242425252626272728280%0%2%2%4%4%6%6%8%8%10%10%12%12%14%14%16%16%18%18%20%20%22%22%JanMarFeb 118%Feb 118%Feb 2818%Feb 2818%Feb 1119%Feb 1119%rain
The percentage of days in which various types of precipitation are observed, excluding trace quantities: rain alone, snow alone, and mixed (both rain and snow fell in the same day).
Rainfall
To show variation within the month and not just the monthly total, we show the rainfall accumulated over a sliding 31-day period centered around each day.
The average sliding 31-day rainfall during February in Costa del Sol is essentially constant, remaining about 1.7 inches throughout, and rarely exceeding 3.9 inches or falling below 0.2 inches.
Average Monthly Rainfall in February in Costa del Sol
Average Monthly Rainfall in February in Costa del SolFeb11223344556677889910101111121213131414151516161717181819192020212122222323242425252626272728280 in0 in1 in1 in2 in2 in3 in3 in4 in4 in5 in5 in6 in6 in7 in7 inJanMarFeb 11. 7 inFeb 11.7 inFeb 281.7 inFeb 281.7 inFeb 111.7 inFeb 111.7 in
The average rainfall (solid line) accumulated over the course of a sliding 31-day period centered on the day in question, with 25th to 75th and 10th to 90th percentile bands. The thin dotted line is the corresponding average snowfall.
Over the course of February in Costa del Sol, the length of the day is increasing. From the start to the end of the month, the length of the day increases by 58 minutes, implying an average daily increase of 2 minutes, 8 seconds, and weekly increase of 14 minutes, 56 seconds.
The shortest day of the month is February 1, with 10 hours, 24 minutes of daylight and the longest day is February 28, with 11 hours, 21 minutes of daylight.
Hours of Daylight and Twilight in February in Costa del Sol
Hours of Daylight and Twilight in February in Costa del SolFeb11223344556677889910101111121213131414151516161717181819192020212122222323242425252626272728280 hr24 hr4 hr20 hr8 hr16 hr12 hr12 hr16 hr8 hr20 hr4 hr24 hr0 hrJanMarnightnightdaydayFeb 110 hr, 24 minFeb 110 hr, 24 minFeb 2811 hr, 21 minFeb 2811 hr, 21 min
The number of hours during which the Sun is visible (black line). From bottom (most yellow) to top (most gray), the color bands indicate: full daylight, twilight (civil, nautical, and astronomical), and full night.
The latest sunrise of the month in Costa del Sol is 8:19 AM on February 1 and the earliest sunrise is 30 minutes earlier at 7:49 AM on February 28.
The earliest sunset is 6:43 PM on February 1 and the latest sunset is 28 minutes later at 7:11 PM on February 28.
Daylight saving time is observed in Costa del Sol during 2022, but it neither starts nor ends during February, so the entire month is in standard time.
For reference, on June 21, the longest day of the year, the Sun rises at 6:59 AM and sets 14 hours, 40 minutes later, at 9:39 PM, while on December 21, the shortest day of the year, it rises at 8:26 AM and sets 9 hours, 39 minutes later, at 6:05 PM.
Sunrise & Sunset with Twilight and Daylight Saving Time in February in Costa del Sol
Sunrise & Sunset with Twilight and Daylight Saving Time in February in Costa del SolFeb11223344556677889910101111121213131414151516161717181819192020212122222323242425252626272728282 AM4 AM6 AM8 AM10 AM12 PM2 PM4 PM6 PM8 PM10 PM12 AM2 AMJanMar7:49 AM7:49 AMFeb 287:11 PMFeb 287:11 PM8:19 AM8:19 AMFeb 16:43 PMFeb 16:43 PM8:04 AM8:04 AMFeb 166:59 PMFeb 166:59 PMSolarMidnightSolarMidnightSolarNoonSunriseSunset
The solar day over the course of February. From bottom to top, the black lines are the previous solar midnight, sunrise, solar noon, sunset, and the next solar midnight. The day, twilights (civil, nautical, and astronomical), and night are indicated by the color bands from yellow to gray.
The figure below presents a compact representation of the sun’s elevation (the angle of the sun above the horizon) and azimuth (its compass bearing) for every hour of every day in the reporting period. The horizontal axis is the day of the year and the vertical axis is the hour of the day. For a given day and hour of that day, the background color indicates the azimuth of the sun at that moment. The black isolines are contours of constant solar elevation.
Solar Elevation and Azimuth in February in Costa del Sol
Solar Elevation and Azimuth in February in Costa del SolFeb112233445566778899101011111212131314141515161617171818191920202121222223232424252526262727282812 AM12 AM2 AM2 AM4 AM4 AM6 AM6 AM8 AM8 AM10 AM10 AM12 PM12 PM2 PM2 PM4 PM4 PM6 PM6 PM8 PM8 PM10 PM10 PM12 AM12 AMJanMar00101020203030400010102020303040
northeastsouthwest
Solar elevation and azimuth over the course of February 2022. The black lines are lines of constant solar elevation (the angle of the sun above the horizon, in degrees). The background color fills indicate the azimuth (the compass bearing) of the sun. The lightly tinted areas at the boundaries of the cardinal compass points indicate the implied intermediate directions (northeast, southeast, southwest, and northwest).
The figure below presents a compact representation of key lunar data for February 2022. The horizontal axis is the day, the vertical axis is the hour of the day, and the colored areas indicate when the moon is above the horizon. The vertical gray bars (new Moons) and blue bars (full Moons) indicate key Moon phases. The label associated with each bar indicates the date and time that the phase is obtained, and the companion time labels indicate the rise and set times of the Moon for the nearest time interval in which the moon is above the horizon.
Moon Rise, Set & Phases in February in Costa del Sol
The time in which the moon is above the horizon (light blue area), with new moons (dark gray lines) and full moons (blue lines) indicated. The shaded overlays indicate night and civil twilight.
Feb 2022
Illumination
Moonrise
Moonset
Moonrise
Meridian Passing
Distance
1
0%
8:49 AM
ESE
7:04 PM
WSW
–
1:56 PM
S
227,508 mi
2
2%
9:29 AM
ESE
8:16 PM
WSW
–
2:52 PM
S
230,140 mi
3
7%
10:02 AM
ESE
9:25 PM
W
–
3:43 PM
S
233,441 mi
4
14%
10:31 AM
E
10:30 PM
W
–
4:29 PM
S
237,107 mi
5
23%
10:57 AM
E
11:33 PM
W
–
5:13 PM
S
240,816 mi
6
32%
11:23 AM
E
–
–
5:56 PM
S
244,268 mi
7
42%
–
12:34 AM
WNW
11:49 AM
ENE
6:38 PM
S
247,215 mi
8
50%
–
1:34 AM
WNW
12:17 PM
ENE
7:22 PM
S
249,474 mi
9
62%
–
2:33 AM
WNW
12:48 PM
ENE
8:07 PM
S
250,935 mi
10
71%
–
3:32 AM
WNW
1:24 PM
ENE
8:55 PM
S
251,563 mi
11
79%
–
4:30 AM
WNW
2:05 PM
ENE
9:44 PM
S
251,389 mi
12
87%
–
5:26 AM
WNW
2:52 PM
ENE
10:35 PM
S
250,504 mi
13
93%
–
6:17 AM
WNW
3:45 PM
ENE
11:26 PM
S
249,042 mi
14
95%
–
7:03 AM
WNW
4:44 PM
ENE
–
–
15
97%
–
7:43 AM
WNW
5:45 PM
ENE
12:16 AM
S
247,161 mi
16
100%
–
8:18 AM
WNW
6:48 PM
ENE
1:05 AM
S
245,027 mi
17
100%
–
8:49 AM
WNW
7:52 PM
ENE
1:52 AM
S
242,788 mi
18
98%
–
9:17 AM
W
8:56 PM
E
2:38 AM
S
240,564 mi
19
94%
–
9:44 AM
W
10:00 PM
E
3:22 AM
S
238,436 mi
20
88%
–
10:11 AM
W
11:05 PM
E
4:07 AM
S
236,447 mi
21
79%
–
10:39 AM
WSW
–
4:53 AM
S
234,614 mi
22
69%
12:13 AM
ESE
11:10 AM
WSW
–
5:42 AM
S
232,942 mi
23
50%
1:22 AM
ESE
11:46 AM
WSW
–
6:34 AM
S
231,446 mi
24
46%
2:33 AM
ESE
12:28 PM
WSW
–
7:31 AM
S
230,169 mi
25
34%
3:44 AM
ESE
1:20 PM
WSW
–
8:32 AM
S
229,191 mi
26
23%
4:51 AM
SE
2:20 PM
SW
–
9:36 AM
S
228,625 mi
27
14%
5:50 AM
ESE
3:29 PM
WSW
–
10:40 AM
S
228,598 mi
28
7%
6:41 AM
ESE
4:41 PM
WSW
–
11:41 AM
S
229,217 mi
We base the humidity comfort level on the dew point, as it determines whether perspiration will evaporate from the skin, thereby cooling the body. Lower dew points feel drier and higher dew points feel more humid. Unlike temperature, which typically varies significantly between night and day, dew point tends to change more slowly, so while the temperature may drop at night, a muggy day is typically followed by a muggy night.
The chance that a given day will be muggy in Costa del Sol is essentially constant during February, remaining around 0% throughout.
For reference, on August 17, the muggiest day of the year, there are muggy conditions 48% of the time, while on December 7, the least muggy day of the year, there are muggy conditions 0% of the time.
Humidity Comfort Levels in February in Costa del Sol
Humidity Comfort Levels in February in Costa del SolFeb11223344556677889910101111121213131414151516161717181819192020212122222323242425252626272728280%0%10%10%20%20%30%30%40%40%50%50%60%60%70%70%80%80%90%90%100%100%JanMarFeb 150%Feb 150%Feb 10%Feb 10%Feb 280%Feb 280%comfortablecomfortabledrydry
The percentage of time spent at various humidity comfort levels, categorized by dew point.
This section discusses the wide-area hourly average wind vector (speed and direction) at 10 meters above the ground. The wind experienced at any given location is highly dependent on local topography and other factors, and instantaneous wind speed and direction vary more widely than hourly averages.
The average hourly wind speed in Costa del Sol is essentially constant during February, remaining within 0.2 miles per hour of 10.3 miles per hour throughout.
For reference, on February 21, the windiest day of the year, the daily average wind speed is 10.5 miles per hour, while on August 14, the calmest day of the year, the daily average wind speed is 7.2 miles per hour.
The highest daily average wind speed during February is 10.5 miles per hour on February 21.
Average Wind Speed in February in Costa del Sol
Average Wind Speed in February in Costa del SolFeb11223344556677889910101111121213131414151516161717181819192020212122222323242425252626272728280 mph0 mph5 mph5 mph20 mph20 mph25 mph25 mphJanMarFeb 2110. 5 mphFeb 2110.5 mphFeb 110.2 mphFeb 110.2 mph
The average of mean hourly wind speeds (dark gray line), with 25th to 75th and 10th to 90th percentile bands.
The hourly average wind direction in Costa del Sol throughout February is predominantly from the east, with a peak proportion of 41% on February 28.
Wind Direction in February in Costa del Sol
Wind Direction in February in Costa del SolFeb11223344556677889910101111121213131414151516161717181819192020212122222323242425252626272728280%100%20%80%40%60%60%40%80%20%100%0%JanMarwesteastnorthsouth
northeastsouthwest
The percentage of hours in which the mean wind direction is from each of the four cardinal wind directions, excluding hours in which the mean wind speed is less than 1.0 mph. The lightly tinted areas at the boundaries are the percentage of hours spent in the implied intermediate directions (northeast, southeast, southwest, and northwest).
Costa del Sol is located near a large body of water (e.g., ocean, sea, or large lake). This section reports on the wide-area average surface temperature of that water.
The average surface water temperature in Costa del Sol is essentially constant during February, remaining around 59°F throughout.
The lowest average surface water temperature during February is 59°F on February 17.
Average Water Temperature in February in Costa del Sol
Average Water Temperature in February in Costa del SolFeb112233445566778899101011111212131314141515161617171818191920202121222223232424252526262727282857.0°F57.0°F57.5°F57.5°F58.0°F58.0°F58.5°F58.5°F59.0°F59.0°F59.5°F59.5°F60.0°F60.0°F60.5°F60.5°F61.0°F61.0°F61.5°F61.5°F62.0°F62.0°FJanMarFeb 1759°FFeb 1759°FFeb 159°FFeb 159°FFeb 2859°FFeb 2859°F
The daily average water temperature (purple line), with 25th to 75th and 10th to 90th percentile bands.
Definitions of the growing season vary throughout the world, but for the purposes of this report, we define it as the longest continuous period of non-freezing temperatures (≥ 32°F) in the year (the calendar year in the Northern Hemisphere, or from July 1 until June 30 in the Southern Hemisphere).
Temperatures in Costa del Sol are sufficiently warm year round that it is not entirely meaningful to discuss the growing season in these terms. We nevertheless include the chart below as an illustration of the distribution of temperatures experienced throughout the year.
Time Spent in Various Temperature Bands and the Growing Season in February in Costa del Sol
Time Spent in Various Temperature Bands and the Growing Season in February in Costa del SolFeb11223344556677889910101111121213131414151516161717181819192020212122222323242425252626272728280%100%10%90%20%80%30%70%40%60%50%50%60%40%70%30%80%20%90%10%100%0%JanMar90%Feb 190%Feb 198%Feb 2898%Feb 2893%Feb 1193%Feb 1190%Jan 290%Jan 284%Jan 1684%Jan 16very coldcoldcoolcomfortable
frigid 15°F freezing 32°F very cold 45°F cold 55°F cool 65°F comfortable 75°F warm 85°F hot 95°F sweltering
The percentage of time spent in various temperature bands. The black line is the percentage chance that a given day is within the growing season.
Growing degree days are a measure of yearly heat accumulation used to predict plant and animal development, and defined as the integral of warmth above a base temperature, discarding any excess above a maximum temperature. In this report, we use a base of 50°F and a cap of 86°F.
The average accumulated growing degree days in Costa del Sol are gradually increasing during February, increasing by 160°F, from 154°F to 313°F, over the course of the month.
Growing Degree Days in February in Costa del Sol
Growing Degree Days in February in Costa del SolFeb1122334455667788991010111112121313141415151616171718181919202021212222232324242525262627272828150°F150°F200°F200°F250°F250°F300°F300°F350°F350°F400°F400°FJanMarFeb 1154°FFeb 1154°FFeb 28313°FFeb 28313°FFeb 11208°FFeb 11208°F
The average growing degree days accumulated over the course of February, with 25th to 75th and 10th to 90th percentile bands.
This section discusses the total daily incident shortwave solar energy reaching the surface of the ground over a wide area, taking full account of seasonal variations in the length of the day, the elevation of the Sun above the horizon, and absorption by clouds and other atmospheric constituents. Shortwave radiation includes visible light and ultraviolet radiation.
The average daily incident shortwave solar energy in Costa del Sol is increasing during February, rising by 1.1 kWh, from 3.3 kWh to 4.4 kWh, over the course of the month.
Average Daily Incident Shortwave Solar Energy in February in Costa del Sol
Average Daily Incident Shortwave Solar Energy in February in Costa del SolFeb11223344556677889910101111121213131414151516161717181819192020212122222323242425252626272728280 kWh0 kWh2 kWh2 kWh3 kWh3 kWh4 kWh4 kWh5 kWh5 kWh5 kWh5 kWh6 kWh6 kWh7 kWh7 kWhJanMarFeb 13.3 kWhFeb 13.3 kWhFeb 284.4 kWhFeb 284.4 kWhFeb 163. 8 kWhFeb 163.8 kWh
The average daily shortwave solar energy reaching the ground per square meter (orange line), with 25th to 75th and 10th to 90th percentile bands.
For the purposes of this report, the geographical coordinates of Costa del Sol are 36.676 deg latitude, -4.425 deg longitude, and 0 ft elevation.
The topography within 2 miles of Costa del Sol is essentially flat, with a maximum elevation change of 0 feet and an average elevation above sea level of 0 feet. Within 10 miles is also essentially flat (0 feet). Within 50 miles is also essentially flat (0 feet).
The area within 2 miles of Costa del Sol is covered by water (94%), within 10 miles by water (49%) and cropland (20%), and within 50 miles by water (45%) and cropland (31%).
This report illustrates the typical weather in Costa del Sol, based on a statistical analysis of historical hourly weather reports and model reconstructions from January 1, 1980 to December 31, 2016.
The details of the data sources used for this report can be found on the Málaga Airport page.
Disclaimer
The information on this site is provided as is, without any assurances as to its accuracy or suitability for any purpose. Weather data is prone to errors, outages, and other defects. We assume no responsibility for any decisions made on the basis of the content presented on this site.
We draw particular cautious attention to our reliance on the MERRA-2 model-based reconstructions for a number of important data series. While having the tremendous advantages of temporal and spatial completeness, these reconstructions: (1) are based on computer models that may have model-based errors, (2) are coarsely sampled on a 50 km grid and are therefore unable to reconstruct the local variations of many microclimates, and (3) have particular difficulty with the weather in some coastal areas, especially small islands.
We further caution that our travel scores are only as good as the data that underpin them, that weather conditions at any given location and time are unpredictable and variable, and that the definition of the scores reflects a particular set of preferences that may not agree with those of any particular reader.
Please review our full terms contained on our Terms of Service page.
What’s The Weather Like In Costa del Sol in February?
The weather in February in the Costa Del Sol is unpredictable, alternating between cold days and warm ones. But compared with other parts of northern Europe it’s quite mild and sunny.
Is It Good To Visit The Costa Del Sol In February?
As this is a quiet part of the year you’ll be able to experience the resort as the locals do and get a better deal on travel and accommodation.
How Warm Is The Costa Del Sol In February?
You can expect an average temperature of 13ºC with highs of 16ºC and lows of 7ºC.
When Is The Almond Tree Season In Costa Del Sol?
Thanks to the slightly higher temperatures in February, the almond trees bloom in this month. They’re the first trees to flower and are a welcome sight.
Average Sunshine Hours and Rain
The average amount of sunshine hours in February is six hours aday, with 13 days of rainfall, approximately totalling up to 75mm of rain.
Costa del Sol Hotels in February
Travellers who would prefer to stay in a hostel should consider Hostel Guadalupe over in Torremolinos. Located very close to the central Torremolinos beach, Bajondillo, they welcome thousands of visitors throughout the year from all across the world.
This is a place where you can rest your head while making new friends along the way. Each room has balconies or terraces that overlook either the Torremolinos heartland, or the sea, depending on where you are housed. There’s a good on-site restaurant as well.
Another hotel set near a beach is the all-inclusive VIK Gran Hotel Costa del Sol. It is within easy reach of two major golf clubs, and the nearest beach in Mijas. Hotel facilities include an outdoor pool, a restaurant and a café. The guestrooms offer wireless internet access, and balconies with delightful views of the sea or nearby mountains.
Those looking to enjoy a romantic break should earmark Hotel Nerja Princess. This modest sized three-star hotel in Nerja is cosy and very reasonably priced off-season. Appealing facilities include a Jacuzzi and a sauna nd more.
Jardines De La Reina Boutique Bed & Breakfast in Marbella is another excellent choice. The facility can hold five couples or families, and is centrally located on the Costa del Sol, making it easy to enjoy trips across the island. Each room has an en-suite bathroom, private patio and a mini bar, plus this charming B&B is handily placed less than 10 minutes away from the town centre.
Costa del Sol Beach for February
Cabopino beach, only 12 km from Marbella and 14 km from Fuengirola, is set among the Artola dunes and borders the Cabopino Marina. This is a lovely sandy beach fringed by pine trees and is well sheltered from the elements, with artificial reefs on either side of the beach to help keep waves and wind at bay.
There are also some good beachside bars and restaurants nearby, plenty of parking and lifeguards watch the beach with eagle eyes throughout the summer. Water-related activities are available too, plus this beach offers a spectacular view along long the coast to Marbella, Gibraltar and Africa and is one of the resort’s few beaches that aren’t flanked by concrete behemoths.
Santa Ana beach in Benalmadena is close to the marina and is 500 metres long. While it gets jam-packed in the summer, February is a good time to come and enjoy this Blue Flag beach. Also, Torre Bermeja beach is only a pebble’s throw away; the two beaches are only separated by an artificial dyke. Santa Ana beach has a restaurant, free parking and wheelchair access.
Bars and Restaurants
Some of the finest Italian food to be found on the Costa del Sol can be found at De Fano restaurant in Benalmadena. Soak up the laid back atmosphere and eat al fresco on the terrace overlooking the harbour. This restaurant is definitely good value for money, and is the place to beeline to if you fancy a tasty pizza or big plate of pasta.
Restaurante Zenart in Malaga is not easy to find, but once you do track it down, it’s guaranteed to satiate any cravings for food of the Asian persuasion, namely Japanese food. The chef prepares authentic Japanese dishes from scratch, the staff are super friendly and the décor is suitably exotic.
The El Cantor de Jazz venue in Malaga is ideal for holidaymakers who want to enjoy a laidback atmosphere, friendly service and live jazz nights (held here every Thursday evening).
Arguably the most well known English bar in Fuengirola is The London Pub. Located centrally on the busy Fuengirola promenade, it is close to many hotels and restaurants, so you can really make a night of it. The bar is open until 4am, and the choice of music is eclectic with some classic tunes from yesteryear bands like The Beatles and The Rolling Stones, to today’s more upbeat pop hits.
Things to do in Costa del Sol in February
Malaga Cathedral is one of Costa del Sol’s most historic and iconic buildings. This structure dates back to the 15th century, and showcases stunning Renaissance architecture. Situated around the edge of the cathedral are little chapels, which are dedicated to the different saints of Spain, who are annually celebrated during the year via a selection of festivals, feasts and fiestas.
Little ones will no doubt love Parque De La Paloma in Benalmadena. The top of the park has massive climbing facilities and an activity centre, along with a playground and a smaller climbing frame for the smaller kids. This attraction is also ideal for those who just fancy a gentle stroll around its 200,000 square metres of picturesque parkland, don’t forget to pack a picnic. The park is home to a wide array of birdlife, including roosters and peacocks, plus there is a flea market and fruit and vegetable market based within the park every Wednesday.
weather by month, temperature, precipitation, when to go
The Costa del Sol (literally, “Coast of the Sun”), the part of the Spanish southern coast belonging to the province of Malaga, has a Mediterranean climate, with mild, relatively rainy winters and hot, sunny summers. There are towns like Estepona, San Pedro de Alcántara, Puerto Banús, Marbella, Fuengirola, Mijas, Benalmádena, Torremolinos, Málaga, Velez-Málaga, Torre del Mar, Torrox, and Nerja.
The wind blows frequently: not by accident, the Costa del Sol used to be called Costa del Viento (“windy coast”). In the cold half of the year, the wind blows along with Atlantic disturbances, while in summer, it blows as sea breeze in the afternoon. In the westernmost part (see Estepona), the Levante, the cool wind from the east, can blow in summer, though less frequently than in the province of Cadiz.
Here are the average temperatures in Marbella.
Marbella – Average temperatures
Month
Min (°C)
Max (°C)
Mean (°C)
Min (°F)
Max (°F)
Mean (°F)
January
8
17
12.5
46
63
54.5
February
8
18
13
46
64
55.4
March
9
19
14
48
66
57. 2
April
11
21
16
52
70
60.8
May
14
24
19
57
75
66.2
June
18
28
23
64
82
73.4
July
20
30
25
68
86
77
August
21
31
26
70
88
78.8
September
19
28
23.5
66
82
74.3
October
15
24
19.5
59
75
67.1
November
11
20
15.5
52
68
59.9
December
9
17
13
48
63
55. 4
Year
13.6
23.1
18.3
56.5
73.6
65
Rainfall is not abundant, and follows the Mediterranean pattern, in fact, most of it falls from October to March (in autumn and winter, it can sometimes rain a lot, especially in the western part), while in summer, it almost never rains. Also, rainfall becomes gradually less abundant proceeding from west to east: the average ranges from 690 millimeters (27 inches) per year in Estepona, to 585 mm (23 in) in Marbella, to 525 mm (20.5 in) in Málaga, to 450 mm (17.5 in) in Nerja.
This is the average rainfall in Marbella.
Marbella – Average precipitation
Month
Millimeters
Inches
Days
January
85
3.3
9
February
75
3
7
March
60
2. 4
6
April
40
1.6
6
May
25
1
5
June
15
0.6
2
July
2
0.1
0
August
5
0.2
1
September
15
0.6
2
October
55
2.2
6
November
115
4.5
11
December
100
3.9
10
Year
585
23
65
Winter, from December to February, is mild, and is characterized by sunny periods alternating with periods of bad weather, with wind and rain.
There is a good number of sunny days, with daytime temperatures reaching 18/20 °C (64/68 °F). With the wind from Africa, it can even exceed 20 °C (68 °F).
Very cold days are rare: only in the coldest nights, the temperature can go down to the freezing point, but even in these cases, it usually rises above 10 °C (50 °F) during the day.
In practice, it never snows.
Spring, from March to May, is mild and sunny, with rainy days still possible, but not very frequent. By May, and sometimes already by April, the first hot days can occur, with highs around 30 °C (86 °F).
Summer, from June to mid-September, is hot and sunny. Typically, temperatures hover about 28 °C (82 °F) in June and September and about 30/31 °C (86/88 °F) in July and August, the weather is hot and muggy, but the sea breeze blows, in short, the typical Mediterranean summer. However, when the wind blows from the interior of Andalusia, the heat can become intense, in fact, the temperature can reach 35/37 °C (95/99 °F) and sometimes up to 40 °C (104 °F). Fortunately, in these cases, there’s a moderate wind and the air becomes dry: it’s better to drink often to avoid dehydration.
Autumn, from mid-September to November, is initially warm, and then becomes gradually milder, while Atlantic fronts become gradually more frequent. In October, there are still many warm and sunny days, especially in the first half. By November, we are well into autumn, actually, the weather is mild, but it’s also often cloudy and rainy. Sometimes, the rains are concentrated in a short time and can be heavy, particularly in the western part.
The amount of sunshine in the Costa del Sol is very good in summer, when clear skies prevail. In the other seasons, there are many sunny periods, but cloudy periods are also possible. However, in winter, the south of Spain is one of the sunniest areas in Europe, and the total annual exceeds 2,900 hours of sunshine.
Here are the average daily sunshine hours in Málaga.
Malaga – Sunshine hours
Month
Average
Total
January
6
180
February
6.5
180
March
7
220
April
8
245
May
9.5
290
June
11
330
July
11
345
August
10
315
September
8.5
255
October
7
215
November
5.5
170
December
5
160
Year
8
2910
The Alboran Sea is never very warm to swim in because of the proximity to the Atlantic Ocean, in fact, it is still very cool in June, when the water temperature is about 20 °C (68 °F), then it rises to 22 °C (72 °F) in July and September, and reaches 23 °C (73 °F) in August, when it becomes acceptable for swimming.
Here are the average sea temperatures in Marbella.
Marbella – Sea temperature
Month
Celsius (°C)
Fahrenheit (°F)
January
16
61
February
15
59
March
15
59
April
16
61
May
17
63
June
20
68
July
22
72
August
23
73
September
22
72
October
20
68
November
18
64
December
17
63
Year
18. 4
65.2
The best time to visit the cities of the Costa del Sol for walks and hikes, corresponds to the months of April, May and October, especially if you plan an excursion to the interior of Andalusia, which is often scorchingly hot in summer.
For a beach holiday, the best period is instead the summer, from June to mid-September. In the westernmost part, it’s better to bring a sweatshirt for cool and windy evenings, especially in June and September, but for safety, also in July and August.
Back to Andalusia.
Weather in Costa del Sol in February 2023, water temperature in Costa del Sol
Check the weather for February before planning your holidays in the Costa del Sol.
Average weather data includes daytime highs and nighttime lows in temperature, rainfall, hours of sunshine, and water temperature data.
Average temperature:
13 ° C
Average temperature during the day:
17 ° C
Average temperature at night:
9000 9 ° C
SUMMER WHAT:
9000 6
Rainfall in mm:
53 mm
Number of rainy days in a month:
15
Water temperature:
13°C0010
The weather is now
26 ° C
2 Forecast for 7 days
Air temperature (Max-Min) by day
Physics on February 20007 February 2022
February 2021
February 2020
February 2019
February 2018
February 2017
February 8016
0003
11 ° C
16 ° C
9 ° C
17 ° C
10 ° C
16 ° C
10 ° C
16 ° C
10 ° C
16 ° C 16 ° C
10°C
16°C
9°C
17°C
9°C
17°C
9°C
9007
15°C
10°C
11
Feb.
17°C
10°C
12
Feb.
16°C
11°C
13
Feb.
17°C
10°C
14
Feb.
18°C
10°C
15
Feb.
17°C
10°C
16
Feb.
17°C
9°C
17
Feb.
17°C
9°C
18
Feb.
16°C
10°C
19
Feb.
16°C
10°C
20
Feb.
17°C
9°C
21
Feb.
17°C
9°C
22
Feb.
18°C
9°C
23
Feb.
18°C
10°C
24
Feb.
17°C
10°C
25
Feb.
17°C
10°C
26
Feb.
17°C
11°C
27
Feb.
17°C
10°C
28
Feb.
18°C
10°C
29
Feb.
19°C
11°C
Daily water temperature in February
11
Feb.
12
Feb.
13
Feb.
14
Feb.
15
Feb.
16
Feb.
17
Feb.
18
Feb.
19
Feb.
20
Feb.
21
Feb.
22
Feb.
23
Feb.
24
Feb.
25
Feb.
26
Feb.
27
Feb.
28
Feb.
29
Feb.
Precipitation by day
Light rain – up to 2.5 mm per hour, moderate rain – up to 8 mm per hour, heavy rain – more than 8 mm per hour, heavy rain from 30 mm.
The maximum daytime temperature in the Costa del Sol is 19.0000 °C, the minimum nighttime temperature is 8.7778 °C. The amount of precipitation in February is usually no more than 53 mm, and the number of hours of sunshine is at least 6.9Ol000 From
, the Dorada Costa
12 ° C
Costa del
17 ° C
Mallorca
14 ° C
170074 17 ° C
Tenerife
19 ° C
Show all over the Kurorta
003
Monthly weather in Costa del Sol
In January
In February
In March
In April
In May
In June
In July
In August
In September
In October
In November
In December
February 25, 2022
9 reviews hotel mapprice
Modern clean rooms with good quality sanitary ware
Disliked: there are no slippers, if there were slippers, then this hotel can safely be given 5 stars. .. Read more
Sergei
February 16, 2022
Alanda Club Marbella Marbella
photo
10 reviews hotel kartseny
the price was not bad.
Disliked : The cleanliness of the room – it was dirty and a lot of other people’s hair. the bed is sold. I had to make the bed myself – “thanks for giving me the linen.” The furniture is old. breakfasts are terrible… Read more0003
photo
16 reviews hotel on map prices
large green area, the complex as a whole.
Disliked: Monotonous breakfast.
Too small gym, one name is that it is a gym.
Noise isolation (you can hear how neighboring rooms are taking … Read more
Weather on the Costa del Sol in February / Sea water temperature / Weather map
World resorts Costa del Sol
Costa del Sol in February on the weather map
This table will help you determine which Costa del Sol resorts are warmest in February, find out where there is less rain and more clear days.
Do you want to know where is the warmest sea? We also provide information about the water temperature in seaside resorts.
Resort name
Air temperature day / night
Cloudy
Rainy days / rainfall
Sea water temperature
Solar clock *
Almuñécar
16.2°C
9.9°C
17.9%
1 day (22.9 mm.)
14.8°C
09h. 54m.
benalmadena
15.7°C
11.4°C
22.0%
1 day (19.1 mm.)
14.8°C
09h. 28m.
benalmadena
15.7°C
11.4°C
21.9%
1 day (19.7 mm.)
14.8°C
09h. 28m.
Gibraltar
13.9°C
10.7°C
30.6%
2 days (40.6 mm.)
15.1°C
08h. 32m.
Malaga
16.6°C
10.5°C
21.9%
1 day (17.9 mm.)
14.7°C
09h. 28m.
Manilva
16.1°C
8.6°C
28.7%
2 days (49.3 mm.)
14.8°C
08h. 45m.
Marbella
16.5°C
9.8°C
25.5%
2 days (31.7 mm.)
14.8°C
09h. 04m.
Mijas
15.0°C
11.1°C
22.2%
1 day (21.1 mm.)
14.8°C
09h. 25m.
Nerja
15.8°C
10.6°C
20.0%
1 day (21.8 mm.)
14.8°C
09h. 41m.
Torremolinos
16.6°C
11.0°C
21.7%
1 day (13.7 mm.)
14.7°C
09h. 30m.
Torrox
14. 5°C
10.2°C
20.6%
1 day (22.2 mm.)
14.7°C
09h. 36m.
Fuengirola
16.2°C
11.9°C
22.6%
1 day (18.3 mm.)
14.8°C
09h. 23m.
Estepona
16.3°C
8.2°C
27.1%
2 days (44.2 mm.)
14.8°C
08h. 55m.
Sundial is an indicator that displays the average number of hours per day during which direct sunlight reaches the earth’s surface. This indicator is influenced by both the length of daylight hours and cloud cover in the daytime.
Climate, weather by months, average temperature in Malaga – Costa del Sol (Spain)
In Malaga – Costa del Sol, the summers are short, hot, humid, arid and partly cloudy, and the winters are long, cool, windy and sometimes cloudy. During the year the temperature usually ranges from 8 °C to 31 °C and is rarely below 4 °C or above 36 °C .
Based on your beach/pool score, the best time of year to visit Malaga-Costa del Sol for hot weather is from end June to start September .
CoolComfortableWarmHotWarmJan Feb Mar Apr May Jun Jul Aug Sep Oct Nov Dec Now Now : 9.2Beach/Pool Point: 9.20.10.1
Monthly weather in Malaga-Costa del Sol. Click on a specific chart for more information.
Hot season lasts 2.9 months , from June 18 to September 15 , with a maximum daily mean temperature above 28 °C . The hottest month of the year in Malaga – Costa del Sol is August , with an average temperature maximum of 30 °C and a minimum of 21 °C .
The cool season lasts 4.1 months , from November 18 to March 20 , with a minimum average daily temperature below 19 °C . The coldest month of the year in Malaga – Costa del Sol – January , with an average temperature maximum of 8 °C and a minimum of 16 °C .
Average high and low temperatures in Malaga-Costa del Sol
Average high and low temperatures in Malaga-Costa del Sol Hot Cool Jan Feb Mar Apr May Jun Jul Aug Sep Oct Nov Dec -20 °C-20 °C-15 °C-15 °C-10 °C- Jan.16 °C22 Jan.16 °C5 Aug.31 °C5 Aug.31 °C8 °C8 °C21 °C21 °C18 Jun.28 °C18 Jun.28 °C15 Sep.28 °C15 Sep.28 °C18 Nov.19°C18 Nov.19 °C20 Mar.19 °C20 Mar.19 °C18 °C18 °C19 °C19 °C11 °C11 °C10 °C10 °CNowNow
Average daily maximum (red line) and minimum (blue line) temperature with ranges from 25th to 75th and 10th to 90th percentiles. The thin dotted lines represent the corresponding average perceived temperatures.
Average
Jan.
Feb.
March
Apr.
May
June
Jul
Aug
Sept.
Oct.
Nov.
dec.
Maximum
16 ° C
17 ° C
19 ° C
21 ° C
24 ° C
27 ° C
° C
9000 30 ° C
28 ° C
9000 23 O.
20°C
17°C
Pace.
12°C
13°C
14°C
16°C
19°C
23°C
25°C
26°C
23°C
19°C
15°C
Minimum
8 ° C
8 ° C
10 ° C
12 ° C
14 ° C
18 ° C
21 ° C
21 ° C
° C
9000 15 ° C
11°C
9°C
The graph below shows a summary of average hourly temperatures for the entire year. The horizontal axis is the day of the year, the vertical axis is the hour of the day, and the color is the average temperature for that hour and day.
Average hourly temperature in Malaga-Costa del Sol
Hourly average temperature Malaga-Costa del SolhaunFebruary MarchApril MayJunJulAug Sep Oct Nov Dec00224466881010121214141616181820202222200NowNowColdColdColdColdCoolCoolComfortableHeatCold
-9 °C frosty 0°C very cold 7 °C cold 13°C cool 18 °C comfortable 24°C heat 29°C hot 35°C znoyno
Average hourly temperature with color coded ranges. Shaded areas represent night and civil twilight.
Jaguarão, Brazil (9,232 kilometers away) and Perth, Australia (14,616 kilometers away) are cities at considerable distances with temperatures closest to Málaga-Costa del Sol (see comparison).
In Malaga-Costa del Sol, the average percentage of sky covered by clouds experiences significant seasonal fluctuations during the year.
The clearer part of the year in Málaga-Costa del Sol starts around June 9, and lasts 2.9 months , ending around September 6, .
The clearest month of the year in Malaga – Costa del Sol – July during which the sky is on average clear , mostly clear or partly cloudy 93% of the time.
The cloudier part of the year begins at about September 6, and lasts for 9. 1 months , ending at about on June 9, .
The cloudiest month of the year in Malaga-Costa del Sol is October , during which the sky averages overcast or mostly local 42% of the time.
Cloud categories in Malaga-Costa del Sol
Cloud categories in Malaga-Costa del SolClearer Cloudy Cloudy Jan Feb Mar Apr May Jun Jul Aug Sep Oct Nov Dec 0%100%10%90%20%80%30%70%40%60%50 %50%60%40%70%30%80%20%90%10%100%0%20 Jul.94%20 Jul.94%30 Oct.55%30 Oct.55%9 Jun.74%9 Jun .74%6 Sep.74%6 Sep.74%NowNowNowSlightly Cloudy Partly Cloudy Cloudy Overcast
Percentage of duration over time of each cloud band, broken down by the percentage of sky covered by clouds.
Share
Jan.
Feb.
March
Apr.
May
June
July
Aug.
Sept.
Oct.
Nov.
dec.
More cloudy
37%
37%
37%
9000 36%
33%
20%
7%
9000 6
9000 31%
9000 42%
41%
9000 41%
more clear
63%
63%
63%
64%
67%
80%
93%
86%
69%
9000 58%
59%
9000%
A wet day is a day on which there is at least 1 millimeter liquid precipitation or liquid equivalent precipitation. The chances of wet days in Malaga – Costa del Sol fluctuate throughout the year.
Wet season lasts 7. 5 months from September 29, to May 12, , with more than 11% probability that the given day will be wet. The month with the most rainy days in Malaga-Costa del Sol is December , when on average over 6.4 days there is at least 1 millimeter precipitation.
Dryer season lasts 4.5 months from 12 May to 29 September . The month with the least rainfall in Malaga-Costa del Sol is July , when on average over 0.2 days there is at least 1 millimeter rainfall.
Among wet days we distinguish those in which there is only rain , only snow , or both . The month with the most days when rains only , in Malaga-Costa del Sol is December with an average of 6.4 days . Based on this classification, the most common form of precipitation during the year is rain only , with a maximum probability of 22% occurring on on November 17, .
Daily chance of rainfall in Malaga-Costa del Sol
Daily chance of precipitation in Malaga-Costa del Sol Wet Wet Dry Jan Feb Mar A May Jun Jul Aug Sep Oct Nov Dec 0%0%10%10%20%20%30%30%40%40%50%50 %60%60%70%70%80%80%90%90%100%100%17Nov22%17Nov22%27Jul0%27Jul0%29Sep11%29Sep11%12May11%12May11%NowNowRain
Percentage of days that various types of precipitation are observed, excluding trace amounts: rain only, snow only, and mixed (both rain and snow fell on the same day).
Days
Jan.
Feb.
March
Apr.
May
June
July
Aug
Sept.
Oct.
Nov.
dec.
Rain
5.9 d.
5.3 d.
4.7 d.
4.7 d.
2.8 d.
1.0 d. 0.4 in.
2.0 in.
5.3 in.
6.1 in.
6.4 in.
To show change over the course of a month, rather than just a monthly total, we show the amount of rainfall accumulated over a sliding 31-day period centered on each day of the year. There are 9 sightings in Malaga-Costa del Sol0906 Significant seasonal fluctuations in monthly rainfall.
The rainy part of the year lasts 8.5 months , from September 12, to May 26, , with rainfall over a rolling 31-day period of at least 13 millimeters . The month with the most rainfall for Malaga-Costa del Sol is November , with an average rainfall of 66 millimeters .
Part of Year no rain lasts 3.5 months , from May 26 to September 12 . The month with the least rainfall for Malaga-Costa del Sol is July , with an average rainfall of 1 millimeters .
Average monthly rainfall atMalaga-Costa del Sol
Average monthly rainfall atMalaga-Costa del Sol Rainy Feb.MarchApr.MayJunJulAug.Sep.Oct.Nov.Dec.0 mm0 mm50 mm50 mm100 mm100 mm150 mm150 mm200 mm200 mm11 Nov.67 mm11 Nov.67 mm26 Jul.1 mm26 Jul .1 mm1945 mm Feb 19 45 mm Feb 12 Sep 13 mm 12 Sep 13 mm 26 May 13 mm 26 May 13 mm Now Now
Average rainfall (solid line) accumulated over a sliding 31-day period centered on the day in question, with ranges of 25–75 and 10–90 percentiles. The thin dotted line is the corresponding mean snowfall.
Jan.
Feb.
March
Apr.
May
June
July
Aug.
Sept.
Oct.
Nov.
dec.
rainfall
48.3 mm
44.6 mm
37.0 mm
33.9 mm
19.5 mm
5.8 mm
0.9 mm
9000 2.5 mm
15 15 .1 mm
47.3 mm
66.5 mm
64.1 mm
The length of the day in Malaga-Costa del Sol varies significantly throughout the year. In 2022 the shortest day of the month is 21 Dec when daylight hours are 9 hours 39 minutes , and the longest is 21 June with daylight hours 2 hours 40 minutes .
Number of hours of daylight and twilight in Malaga – Costa del Sol
Number of hours of daylight and twilight in Málaga-Costa del SolhãoFeb. MarchApr.MayJulyAug.Sep.Oct.Nov.Dec.0h24h4h20h8h16h12h 12:16:08:20:40:24:00:12:00 8:00 Mar. 20: 12:00 8:00 Mar. 20:14:40 h. 40 min. 21 Jun. 12 h. 9min.23 Sep. 12h 9 min.23 Sep. 9h 39min.21 Dec. 9h 39min.21 Dec.nightnightdayNowNow
The number of hours the sun is visible (black line). From the bottom (most yellow) to the top (greyest), the colored bands represent: full daylight, twilight (civil, nautical, and astronomical) and full night.
Hours
Jan.
Feb.
March
Apr.
May
June
Jul
Aug
Sept.
Oct.
Nov.
dec.
Daylight
10.0 hours
10.9 hours
12.0 hours
13.2 hours
14.2 hours
14.6 hours 13.5 hours
12.4 hours
11.2 hours
10.2 hours
9.7 hours
Earliest Sunrise falls on 6:58 on June 13, , and is the latest on 1 hour 40 minutes later on 8:38 on October 29, . The earliest sunset of is at 18:01 on December 6, , and is the latest on 3 hours 39 minutes later at 21:40 on June 28, .
Daylight saving time (DST) enters Málaga-Costa del Sol in 2022, starting in spring 27 March , continuing 7.1 months and ending in autumn on October 30, .
Sunrise and sunset with twilight and DST in Malaga – Costa del Sol
Sunrise and sunset with twilight and DST in Malaga-Costa del SolhainFeb.MarchApr.MayJulyAug.Sep.Oct.Dec.24681012141618202220213 Jun.6:5813 Jun.6:5821:4028 Jun.21:4028 Jun.6 Dec. 18:016 Dec. 18:018:38 Oct 29 8:38 Oct. 27 DST Mar 27 DST Summer Oct 30 Oct 30 Day Night Night Astro Midnight Astro Midnight Astro Noon Sunrise Sunset
Sunny day throughout 2022. From bottom to top, the black lines are the previous solar midnight, sunrise, solar noon, sunset, and the next solar midnight. Day, twilight (civil, nautical, and astronomical) and night are indicated by colored bands ranging from yellow to grey. Daylight Savings Time (DST) and vice versa are marked with “summer time” labels.
The figure below is a compact representation of the sun’s height (the angle of the sun above the horizon) and bearing (its compass direction) for each hour of each day during the reporting period. The horizontal axis is the day of the year and the vertical axis is the hour of the day. For a given day and hour of that day, the background color indicates the azimuth of the sun at that moment. Black isolines are contours of constant solar altitude.
The chart below is a summary of the main lunar data for 2022. The horizontal axis is the day, the vertical axis is the hour of the day, and the colored areas show when the Moon is above the horizon. Vertical gray bars (new moon) and blue bars (full moon) indicate the key phases of the moon.
Sunrise, sunset and phases of the Moon in Malaga – Costa del Sol
Rise, set and moon phases in Malaga-Costa del SolhãFeb.MarchApr.MayJunJulAug. Sep.Oct.Nov.Dec.004488121216162020002 Jan.2 Jan.18 Jan.18 Jan.1 Feb.1 Feb.16 Feb .16 Feb 2 Mar 2 Mar 18 Mar 18 Mar 1 Apr 1 Apr 16 Apr 16 Apr 30 Apr 30 Apr 16 May 16 May 30 May 30 May 14 Jun 14 Jun 29Jun 29 Jun 13 Jul 13 Jul 28 Jul 28 Jul 12 Aug 12 Aug 27 Aug 27 Aug 10 Sep 10 Sep 25 Sep 25 Sep 9 Oct 9 Oct 25 Oct 25 Oct. 8 Nov. 8 Nov. 23 Nov. 23 Nov. 8 Dec. 8 Dec. 23 Dec. 23 Dec.
Time when the Moon is above the horizon (blue area), showing new moon (dark gray lines) and full moon (blue lines). Shaded areas represent night and civil twilight.
We base comfort level on dew point, as it determines whether sweat will evaporate from the skin, cooling the body. A lower dew point makes you feel more dry, while a higher dew point makes you feel more humid. Unlike temperature, which typically varies significantly between day and night, dew point tends to change more slowly, so while temperatures may drop at night, a wet day usually gives way to a wet night.
In Malaga-Costa del Sol, there are significant seasonal fluctuations in the level of perceived humidity.
The wettest period of lasts 3.4 months , from June 23, to October 5, . At this time, the comfort level is characterized as damp , stuffy or heavy at least 12% of the time. Month with the most days of high humidity in Malaga-Costa del Sol – August , with 14.4 days conditions raw or worse.
The least damp day of the year is February 27, when essentially no dampness has ever been observed.
Humidity comfort levels in Malaga-Costa del Sol
Humidity comfort levels in Malaga-Costa del Solsyroy Jan Feb Mar Apr May Jun Jul Aug Sept Oct Nov Dec 0%0%10%10%20%20%30%30%40%40%50%50 %60%60%70%70%80%80%90%90%100%100%27 Feb.0%27 Feb.0%18 Aug.48%18 Aug.48%23 Jun.12%23 Jun.12 %Oct 5 12 % Oct 5 12 %NowNowDampDampComfortableComfortableDryDrySoulDampyWet
dry 13°C comfortable 16°C wet 18 °C damp 21°C stuffy 24°C heavy
Percentage of time spent at different humidity comfort levels, classified by dew point.
Jan.
Feb.
March
Apr.
May
June
July
Aug.
Sept.
Oct.
Nov.
dec.
Raw days
0.0 d.
0.0 d.
0.0 d.
0.0 d.
0.1 d.
2.6 d. 14.4 in.
8.9 in.
1.8 in.
0.1 in.
0.0 in.
This section describes the average hourly wind vector (speed and direction) over a large area at a height of 10 meters above ground. The wind experienced at any given location is highly dependent on local topography and other factors, and instantaneous wind speed and direction vary more widely than hourly averages.
In Malaga-Costa del Sol, the average hourly wind speed experiences significant seasonal fluctuations throughout the year.
More windy part of the year lasts 6.2 months , from October 29 to May 3 , with an average wind speed over 14.2 kilometers per hour . The most windy month of the year in Malaga – Costa del Sol – February with an average hourly wind speed of 16.6 kilometers per hour .
A calmer season lasts 5.8 months , from May 3, to October 29, . The calmest month of the year in Malaga – Costa del Sol – august with average hourly wind speed 11.7 kilometers per hour .
Average wind speed at Malaga Costa del Sol
Average wind speed at Malaga-Costa del Solvetrenowind Jan Feb Mar Apr May Jun Jul Aug Sep Oct Nov Dec 0 km/h0 km/h5 km/h5 km/h10 km/h10 km/h15 km/h15 km /h20 km/h20 km/h25 km/h25 km/h21 Feb.16.9 km/h21 Feb.16.9 km/h14 Aug.11.6 km/h14 Aug.11.6 km/h29 Oct.14, 2 km/h29 Oct 14.2 km/h May 314.2 km/h May 314. 2 km/h0 percentile.
Jan.
Feb.
March
Apr.
May
June
July
Aug.
Sept.
Oct.
Nov.
dec.
Wind speed (kph)
16.1
16.6
15.7
15.1
13.70010
12.2
13.3
15.1
16.2
The prevailing mean hourly wind direction in Malaga-Costa del Sol varies throughout the year.
The wind most often blows from west 2.9 months , from March 29 to June 25 , with the maximum percentage of 43% falling on May 2 . The wind most often blows from east 9.1 months , from on June 25, to on March 29, , with the maximum percentage of 37% of falling on on January 1, .
Wind direction in Malaga – Costa del Sol
Wind direction Malaga-Costa del Sol EZJan Feb Mar Apr May Jun Jul Aug Sep Oct Nov Dec 0%100%20%80%40%60%60%40%80%20%100%0% NowNowWestEastNorth
North East South West
Percentage of hours during which the average wind direction corresponds to each of the four main wind directions, excluding hours in which the average wind speed is less than 1.6 km/h . The slightly shaded areas on the borders are the percentage of hours in the implied intermediate directions (northeast, southeast, southwest, and northwest).
Malaga – Costa del Sol is located near a large body of water (for example, the ocean, sea or large lake). This section describes the average daily surface temperature of this large area of water.
The average water temperature experiences extreme seasonal fluctuations throughout the year.
The season with warmer water lasts 2. 5 months , from July 8 to September 23 , with an average temperature above 21 °C . The month of the year in Malaga-Costa del Sol with the warmest water is August , when the average temperature is 23 °C .
The season with cooler water lasts 4.9 months , from December 1, to April 30, , with an average temperature below 17 °C . The month of the year in Malaga-Costa del Sol with the coldest water is February , when the average temperature is 15 °C .
Malaga-Costa del Sol average water temperature
Average water temperature in Malaga-Costa del Sol-Cool-Jan-Feb-March-May-July-Aug-Sep-Oct-Nov-Dec-14 °C14 °C16 °C16 °C18 °C18 °C20 °C20 °C22 °C22 °C24 °C24 °C26 °C26 °C14 Aug.23 °C14 Aug.23 °C15 °C13 Feb.15 °C13 Feb.8 Jul.21 °C8 Jul.21 °C1 Dec.17 °C1 Dec.17 °C30 Apr.17 ° C30 Apr.17 °CnowNow
Average daily water temperature (purple line) with ranges from 25th to 75th and 10th to 90th percentiles.
Water
Jan.
Feb.
March
Apr.
May
June
July
Aug.
Sept.
Oct.
Nov.
dec.
Temperature
15°C
15°C
15 ° C
16 ° C
17 ° C
20 ° C
22 ° C
23 ° C
22 ° C
20000 20 ° C
° C
OL
To characterize how pleasant the weather is in Malaga-Costa del Sol during the year, we calculate two points for trips.
Tourism score takes into account the presence of clear days without rain with an estimated temperature of 18 °C to 27 °C . Based on this score, the best time of the year to visit Malaga-Costa del Sol for the purpose of general outdoor recreation is from start May to end July and from start September to start October , with the most the highest score falls on the third week of June .
Malaga Tourism Score – Costa del Sol
Malaga Costa del Sol Tourism Scorebest timeJan Feb March Apr May Jun Jul Aug Sep Oct Nov Dec 002244668810108.38.34.24.27.77.77.17.1NowNowNowPrecipitationPrecipitationTemperatureTourism Score
Tourism score (shaded area) and its components: temperature score (red line), cloud score (blue line) and precipitation score (green line).
Beach/Pool score takes into account clear days without rain with expected temperatures between 24 °C and 32 °C . Based on this score, the best time of the year to visit Malaga – Costa del Sol for the purpose of relaxing in hot weather is from late June to early September , with the highest score being in the third week of July .
Beach/pool ball in Malaga – Costa del Sol
Málaga-Costa del Sol Beach/Pool ScoreBest TimeJan Feb Mar Apr May Jun Jul Aug Sept Oct Nov Dec 002244668810109.29.20.10.1NowNowRainfallTemperaturePrecipitationBeach/Pool Score
Beach/Pool Score (907 shaded area) ) and its components: temperature score (red line), cloudiness score (blue line), and precipitation score (green line).
Method
For each hour between 8:00 and 21:00 of each day in the analyzed period (from 1980 to 2016), independent scores are calculated for perceived temperature, cloudiness, and total precipitation. These scores are combined into a single hourly summary score, which is then combined into days, averaged over all years of the analyzed period, and smoothed.
Our cloud score of is 10 for a completely clear sky, falling linearly to 9for mostly clear skies and up to 1 for completely overcast skies.
Our precipitation score of , which is based on three-hour precipitation centered on the hour in question, is 10 for no precipitation, falling linearly to 9 for light precipitation, and to 0 for 1 millimeter precipitation or higher.
Our temperature score for tourism is 0 for perceived temperatures below 10 °C , increasing linearly to 9 for 18 °C , down to 10 for 24°C , falling linearly to 9 for 27°C and to 1 for 32°C or higher.
Our temperature score for beach/pool is 0 for perceived temperatures below 18 °C , increasing linearly to 9 for 24 °C , to 10 for 28 °C , decreasing linearly to 9 for 32 ° C and up to 1 for 38 °C or higher.
Definitions of growing season vary around the world, but in the context of this description, we define it as the longest continuous period of temperatures above freezing (≥ 0°C) in a year (the Northern Hemisphere calendar year, or July 1 to 30 June in the Southern Hemisphere).
Temperatures in Malaga-Costa del Sol are quite warm all year round, so it makes no sense to discuss the growing season on these terms. However, we include the graph below as an illustration of the distribution of temperatures throughout the year.
Time spent in different temperature ranges and growing season in Malaga-Costa del Sol
Time spent in different temperature ranges and growing season in Málaga-Costa del Sol Growing season Jan Feb Mar Apr May Jun Jul Aug Sep Oct Nov Dec 0%100%10%90%20%80%30%70%40%60%50%50%60%40%70%30%80%20%90%10%100%0%90%1 Feb 90%1 Feb 2 Aug . 100%2 Aug.100%NowNowNowColdCoolComfortableWarmVery ColdHot
Icy -9 °C frosty 0°C very cold 7 °C cold 13°C cool 18 °C comfortable 24°C heat 29°C hot 35°C hot
Percentage of time spent in different temperature ranges. The black line is the percentage chance that a given day is within the growing season.
Growth degree days is a measure of annual heat accumulation used to predict the development of plants and animals and is defined as all threshold exceedances of a given temperature minimum, excluding maximum temperature exceedances. In this description, the temperature minimum is 10 °C and maximum 30 °C .
Growth degree days in Malaga-Costa del Sol
Growth Degree Days in Malaga-Costa del SolhaFeb Mar Apr May Jun Jul Aug Sep Oct Nov Dec 0 °C0 °C500 °C500 °C1,000 °C1,000 °C1,500 °C1,500 °C2,000 °C2,000 °C2,500 °C2,500 °C3,000 °C3,000 °C19 Jan. 50 °C19 Jan. 50 °C29 Apr. 500 °C29 Apr. 500 °C 17 Jun. .3,062 °C31 Dec. 3,062 °CNowNow
Average growth degree days accumulated over the year with ranges from 25th to 75th and from 10th to 9th0th percentile.
This section describes the total daily incident shortwave solar energy reaching the earth’s surface over a large area, fully accounting for seasonal variations in day length, the height of the Sun above the horizon, and absorption by clouds and other atmospheric constituents. Shortwave radiation includes visible light and ultraviolet radiation.
The average daily incident shortwave solar energy experiences extreme seasonal fluctuations during the year.
The brighter period of the year lasts 3.4 months , from May 8, to August 20, , with an average daily incident shortwave energy per square meter above 7.1 kWh . The brightest month in Malaga – Costa del Sol is June with an average value of 8. 1 kWh .
The darker period of the year lasts 3.4 months , from October 27, to February 10, , with an average daily incident shortwave energy per square meter below 3.6 kWh . The darkest month in Malaga – Costa del Sol is December with an average value of 2.5 kWh .
Average daily incident shortwave solar energy in Malaga-Costa del Sol
Average daily incident shortwave solar energy in Malaga-Costa del Sollardark dark Jan Feb Mar Apr May Jun Jul Aug Sept Oct Nov Dec 0 kWh0 kWh1 kWh2 kWh2 kWh3 kWh h3 kWh4 kWh4 kWh5 kWh5 kWh6 kWh6 kWh7 kWh7 kWh8 kWh8 kWh9kWh9 kWh2 Jul.8.2 kWh2 Jul.8.2 kWh17 Dec.2.5 kWh17 Dec.2.5 kWh8 May7.1 kWh8 May7.1 kWh20 Aug 7.1 kWh20 Aug 7.1 kWh Feb 10 3.6 kWh Feb 10 3.6 kWhNowNow
25–75 and 10–90 percentile ranges.
Jan.
Feb.
March
Apr.
May
June
Jul
Aug
Sept.
Oct.
Nov.
dec.
Solar energy (kWh)
2.8
3.8
5.2
6.4
7.3
8.1
8.1
7.2
5.7
9000 4.1
9000 3.0
9000 2.5
In this description, the geographic coordinates of Malaga-Costa del Sol are 36.675° latitude, -4.499 ° longitude and height above sea level – 10 m.
The topography within a radius of 3 kilometers from Málaga-Costa del Sol has very significant elevation changes with a maximum elevation change of 276 meters and an average altitude of 26 meters . Within a radius of 16 kilometers has very significant changes in altitude ( 1 142 meters ). Within a radius of 80 kilometers has extreme altitude changes ( 2071 meters ).
The area within a radius of 3 kilometers from the Malaga-Costa del Sol is covered with agricultural vehicles ( 54% ) and Artificial surfaces ( 36% ), in radius of 16 kilometers ––––––––––––––– % ) and farmland ( 28% ), and within a radius of 80 kilometers – water ( 44% ) and farmland ( 31% ).
This report describes typical weather in Malaga-Costa del Sol based on a statistical analysis of historical hourly weather reports and model reconstructions from January 1, 1980 to December 31, 2016.
Temperature and dew point
There is a weather station in Malaga – Costa del Sol that provided fairly reliable reports during the analysis period, so we included it in our network. Where possible, archival temperature and dew point measurements are taken directly from this weather station. This information is derived from the NOAA Integrated Hourly Earth Observation System dataset based on ICAO METARs as required.
In the case of missing or erroneous measurements from this station, we use records from nearby stations adjusted for typical seasonal and daily intra-station differences. For a given day of the year and hour of the day, a backup station is selected to minimize the forecast error for years for which there are measurements for both stations.
Stations we can use as backups include, among others, the following: Federico García Lorca Airport, Gibraltar, Córdoba Airport, Morón Air Base, Sania Ramel Airport, Jerez Airport, Seville San Pablo Airport and Cherif Al Idrissi Airport
Other data
All data related to the position of the Sun (such as sunrise and sunset) are calculated using astronomical formulas from Jean Mius’ Astronomical Algorithms, 2nd Ed. .
All other weather data, including cloudiness, precipitation, wind speed and direction, and solar energy flux, are taken from the MERRA-2 New Time Retrospective Analysis. This reanalysis combines various measurements over a wide area in a modern global meteorological model to reconstruct hourly weather history around the world on a 50 km grid.
Land use data are from the SHARE Global Land Cover Monitoring Network database published by the Food and Agriculture Organization of the United Nations.
Altitude data is from the Shuttle Radar Topographic Mission (SRTM), published by NASA’s Jet Propulsion Laboratory.
The names, locations and time zones of places and some airports are from the GeoNames Geographical Database.
Time zones for airports and weather stations are provided by AskGeo.com.
The information on this site is provided as is, without any guarantee of its accuracy or suitability for any purpose. The weather data may contain errors, glitches and other defects. We are not responsible for any decisions made on the basis of the information provided on this site.


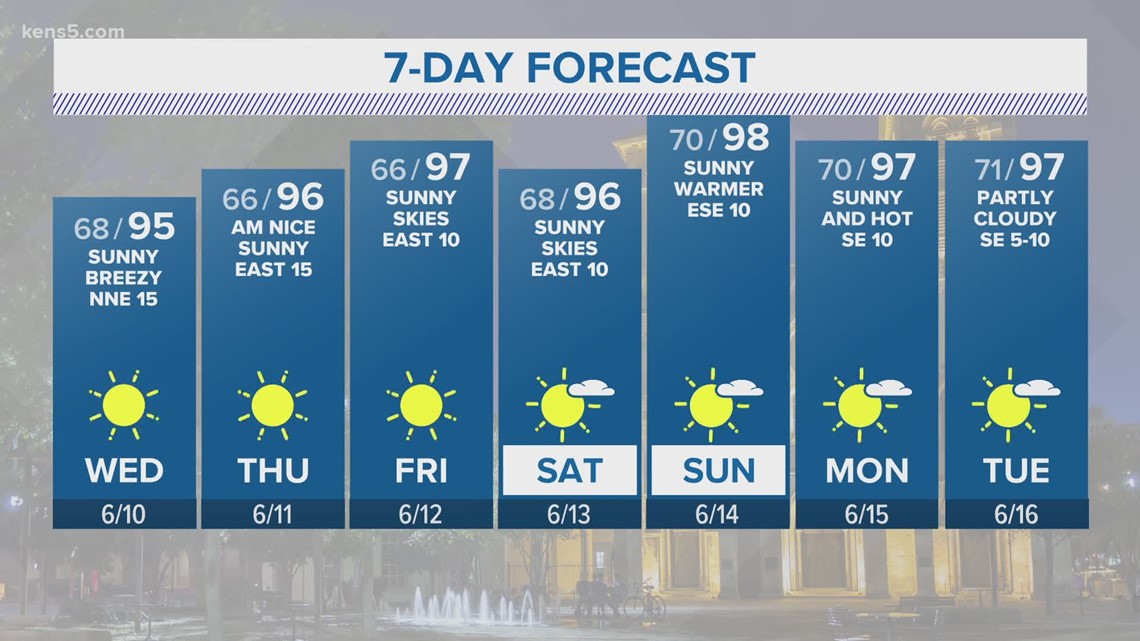 rs/3JK2CgD).
 During the February frosts, we all miss the warmth and sun very much. Traveling to warmer countries this time of year can provide a welcome respite before the final push for spring. At the same time, a pleasant surprise awaits all those who plan to take a vacation and go to the sea: the idea of going on vacation at this time can be very successful! In this article, we will tell you why it is beneficial to relax in the winter, and list best beach destinations in February .
  But there is another reason: by February, we all get tired of the cold winter with short gray weekdays, and a few days spent on the sunny coast near the warm sea can cheer up and add strength in anticipation of spring. But first you need to decide where exactly to go for a beautiful tan and bright positive emotions.
  But the prices for tours to the country of the pharaohs at this time of the year can more than outweigh all the shortcomings: trips to Hurghada and Sharm el-Sheikh are very cheap.
  The average air temperature is +30˚C, while the sea water temperature near the coast is kept at +26˚C. Thanks to the beautiful weather and low prices for tours to India, vacationers from all over the world gather at local resorts in winter. At the same time, North Goa is more suitable for young people who prefer parties and vibrant nightlife, and South Goa offers its guests a more respectable and relaxing holiday on the coast.


 And you can also spend Valentine’s Day truly romantic.
 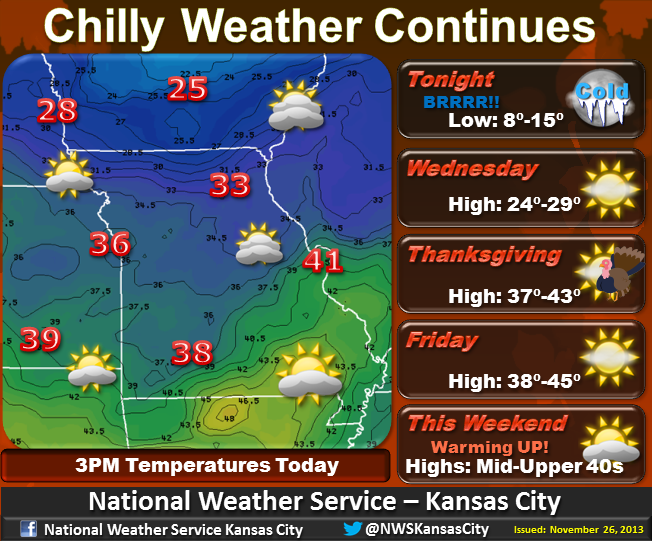 In the last ten days of February, as a rule, the temperature is set with a “+” sign, but it is still too early to talk about spring. The maximum to which the air warms up is +5.
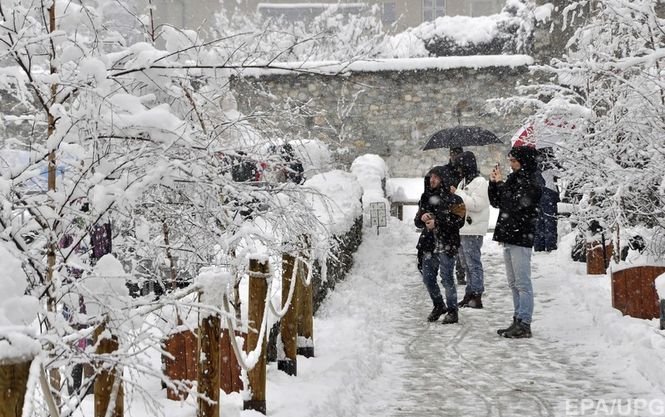

 7°C (60.3°F).
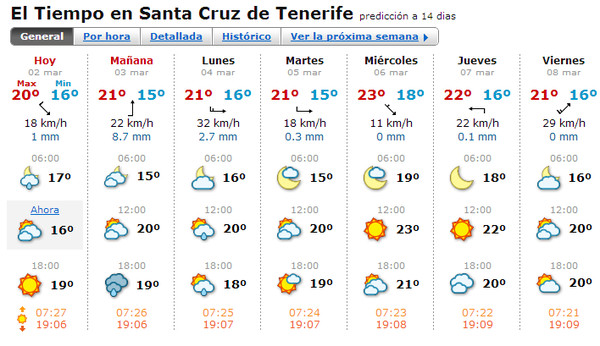
 9km/h 13mph

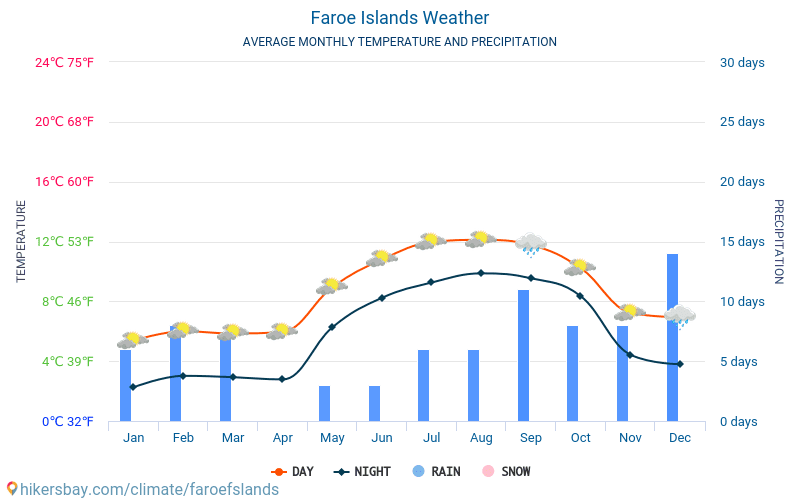
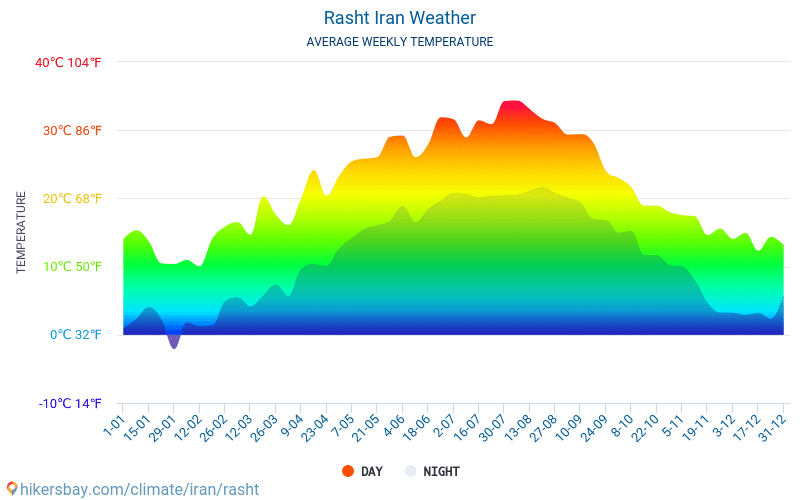 Winter and summer are the seasons that allure loads of tourists to the Canary Islands, which make accommodations a bit expensive. However, in spring and fall, the Canaries continue to offer the same pleasant weather as the peak seasons, if we exclude the tourist crowds.
 It’s modelled after Brazil’s vibrant festival and considered the world’s second-best Carnival in the world. If we talk about the influx of tourism and festivals in the Canary Islands, you may face trouble securing accommodations- or at least affordable ones. So, it advised that plan your vacation at least several months in advance.
 Especially, during the August holiday. Temperatures rise to their highest during the span of these three months- daily highs in Santa Cruz, Tenerife, touch the 80s in August- the probability of rainfall is next to nothing.
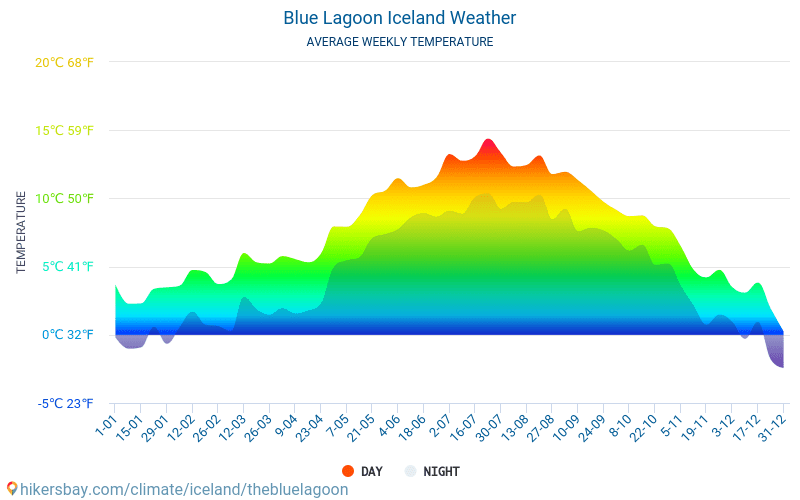 Because we all know that bad weather can ruin all the fun and enjoyment of our vacations.
 You can find information about air temperature, water temperature, precipitation, cloudiness and daylight hours, which were calculated based on observations over the past three years.
 4 °C and 17.4 °C, respectively.
  In Santa Cruz de Tenerife, the average daily sunshine in February is: 7.3 h
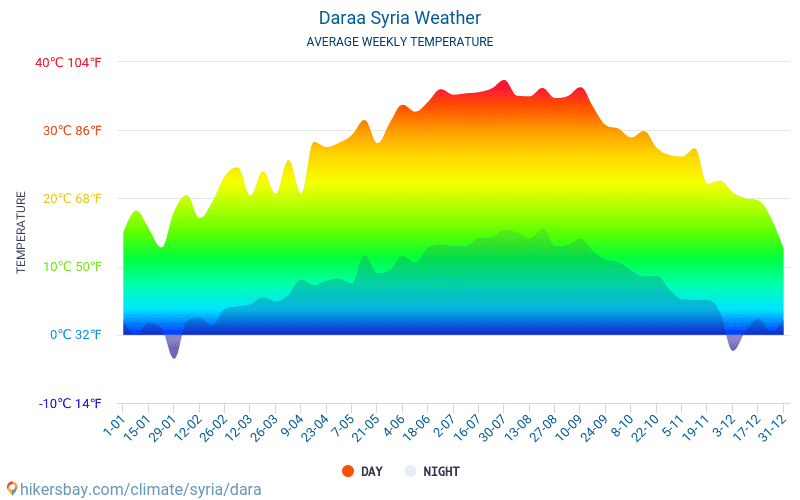

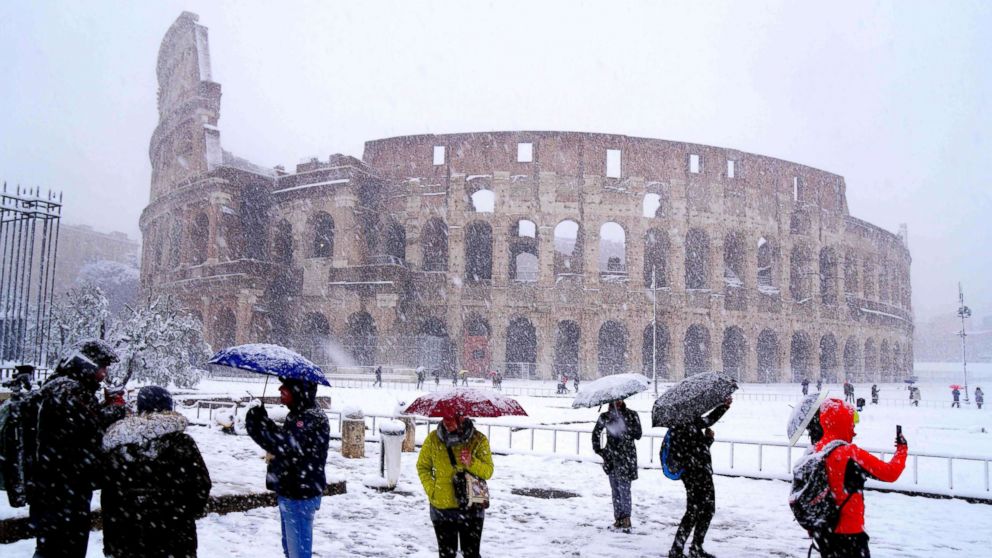 8 °C (28.8 °F) during the day to -7.5 °C (18.5 °F) at night. There are 10 days of rain on average, where the rainfall is 34 mm (1.35 in).
 8 °C (28.8 °F). Don’t forget to pack a warm jacket, gloves and several layers of clothing. It can be really cold with all the usual phenomena like freeze, snow, icy wind.


 GPA
GPA  There is no shortage of trump cards on the travel side this month. It’s even the perfect time to go on vacation. Some destinations in Europe are sunny even in winter, while others, less warm, have something cultural to offer. Here are all our tips for deciding where to travel in Europe in February.
 The shaded overlays indicate night and civil twilight.

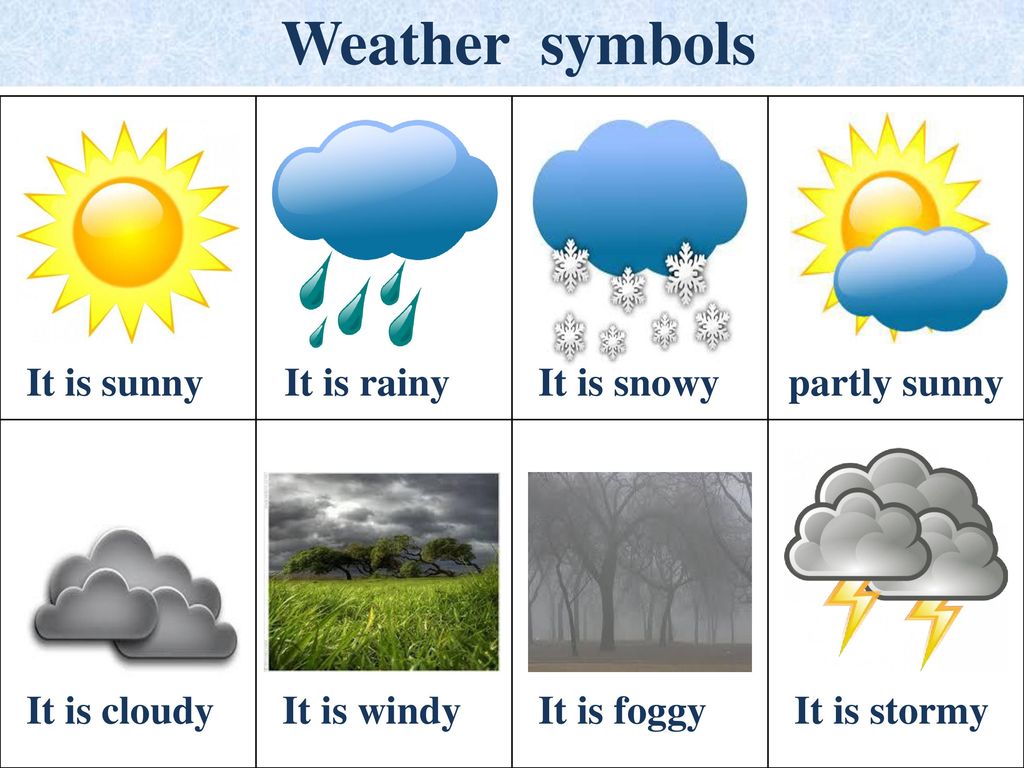

 From bottom to top, the black lines are the previous solar midnight, sunrise, solar noon, sunset, and the next solar midnight. The day, twilights (civil, nautical, and astronomical), and night are indicated by the color bands from yellow to gray.
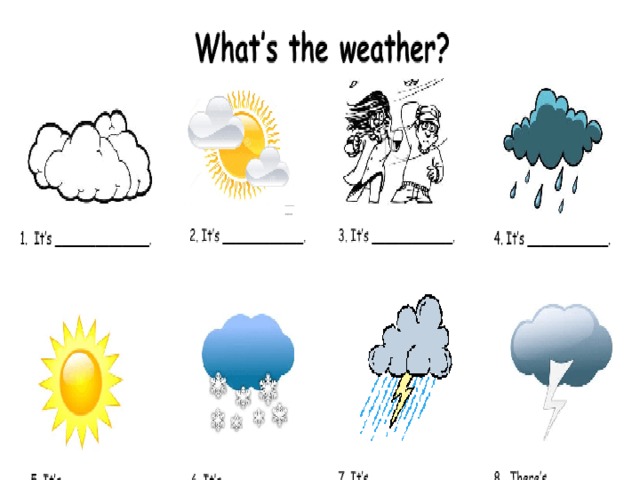 The black lines are lines of constant solar elevation (the angle of the sun above the horizon, in degrees). The background color fills indicate the azimuth (the compass bearing) of the sun. The lightly tinted areas at the boundaries of the cardinal compass points indicate the implied intermediate directions (northeast, southeast, southwest, and northwest).
 The shaded overlays indicate night and civil twilight.
 Lower dew points feel drier and higher dew points feel more humid. Unlike temperature, which typically varies significantly between night and day, dew point tends to change more slowly, so while the temperature may drop at night, a muggy day is typically followed by a muggy night.

 2 mphFeb 2813.2 mphFeb 112.7 mphFeb 112.7 mphFeb 1612.9 mphFeb 1612.9 mph

 The black line is the percentage chance that a given day is within the growing season.
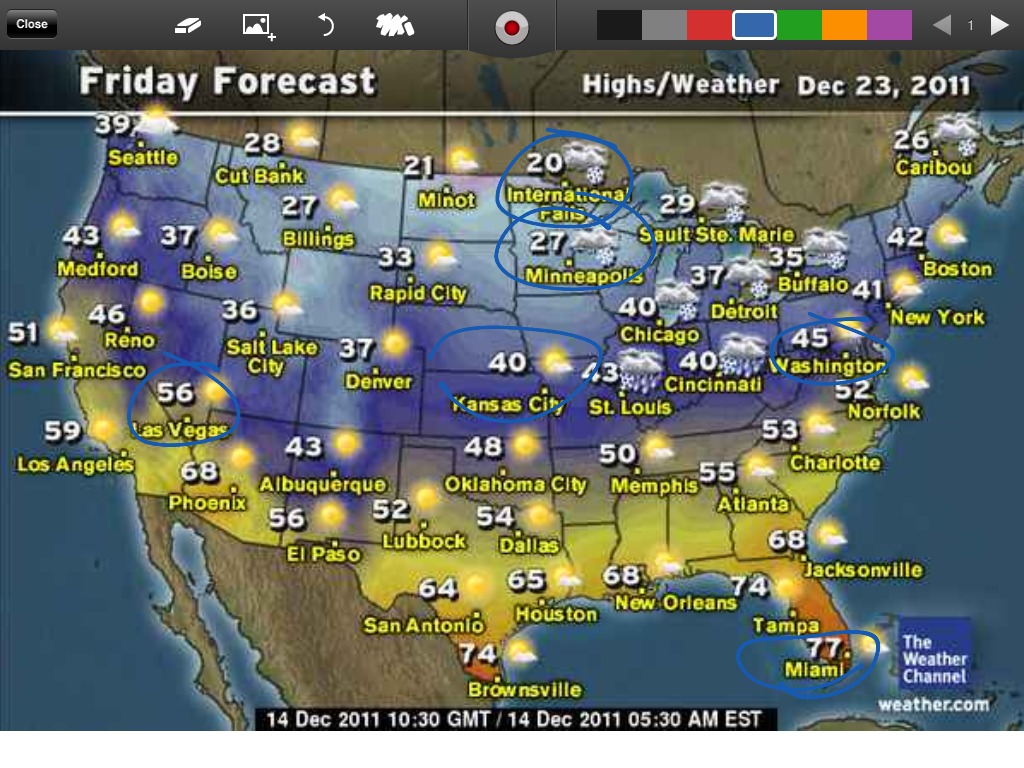
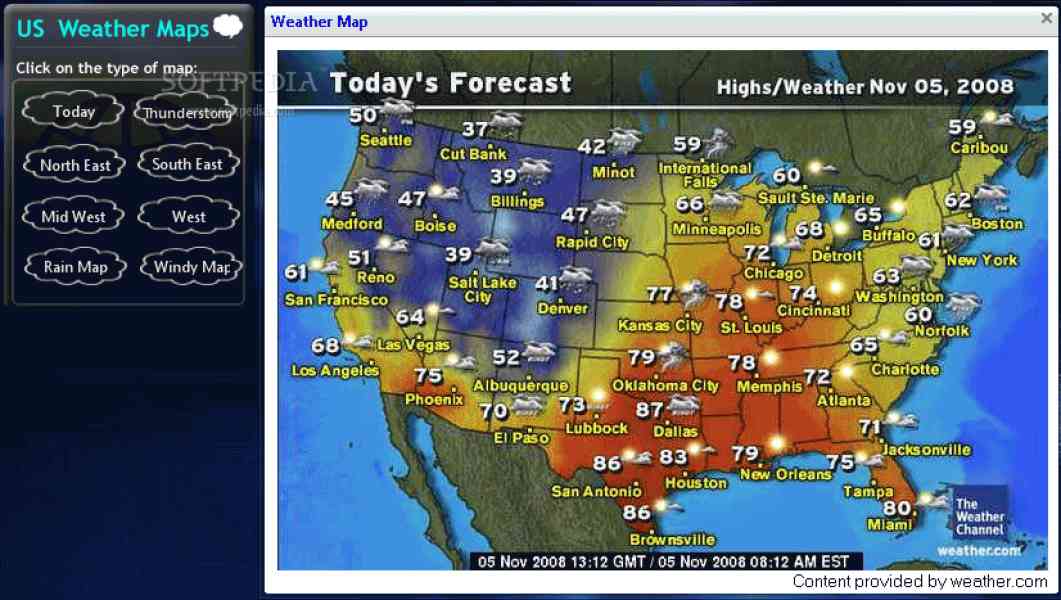 9 kWh
9 kWh
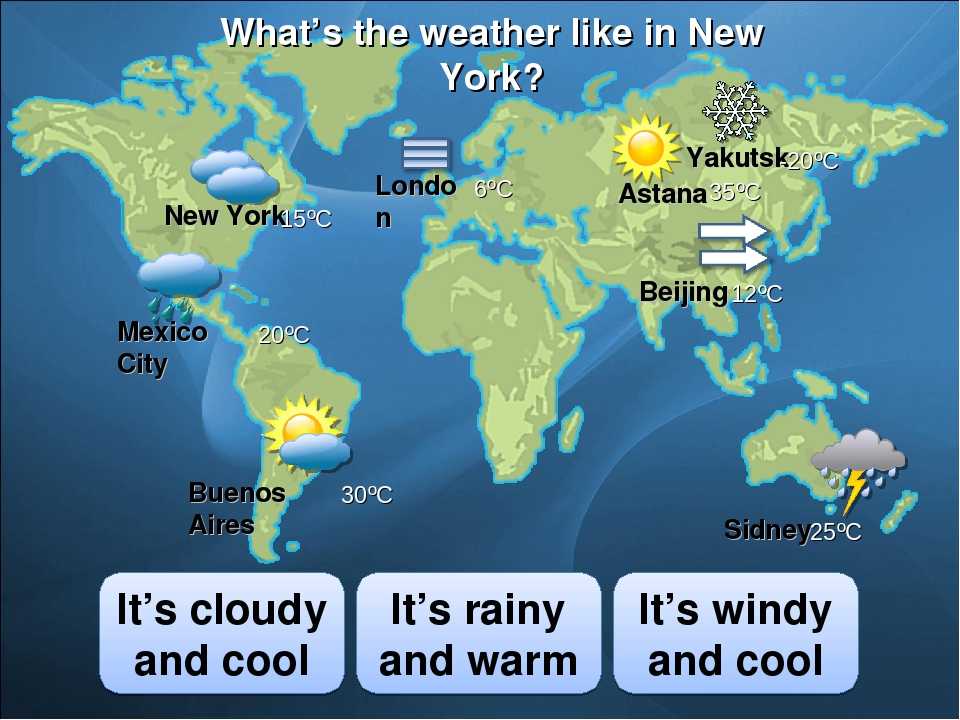
 Like January, February is one of the cooler months in La Gomera but it is still temperate and warm. The island enjoys similar weather conditions, with an average temperature of 18°C during the month. The temperature can vary, reaching highs of 21°C but never dips below 14°C, so you can spend plenty of time outdoors without feeling too cold.
 The island sees around 148mm of precipitation throughout the month with around 13 wet days and just a 12% chance of rain.
 The hotel is an affordable choice but doesn’t lack in facilities, featuring a choice of traditional restaurants, two outdoor pools, sports facilities and regular evening entertainment.
 One of the most popular with both locals and tourists is La Forastera located in San Sebastian. This small, family run restaurant serves a range of fresh and traditional Canarian cuisine with a menu full of delicious homemade tapas dishes.
 Truly a fabulous time to visit any Catholic nation, Carnival in La Gomera and the Canary Islands is a colourful and festive time. Locals wear costumes, conduct parades and feasts occur almost daily between the villages and cities on the island. In addition, a local will be picked to be Queen of the festivities, and there is even a tradition of burying a sardine – a fish that is central to Canarian culture.
 02.2022
  s.
s.  s.
s.  s.
s.  8 mm
8 mm
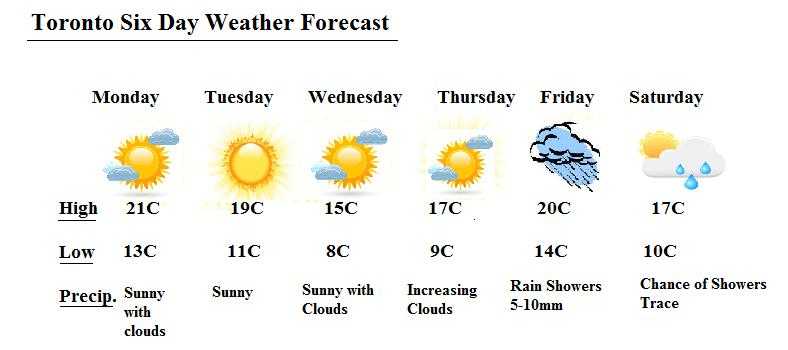 8 (out of 5),
 For example, in the previous month, the air is warmer by about 0.6°C. For comparison, next month the environment is 0.3°C warmer. At night, the temperature in San Sebastian de la Gomera in February drops to +19°C…+17°C. Temperature fluctuations between day and night are 1°C. What is the weather like in San Sebastian de la Gomera at the end of February in the beginning and middle of the month is shown on the chart, according to tourists in Spain, the situation is similar almost everywhere.
 Just in case, take a children’s windbreaker and sweater – it’s cool in the evening, especially when the wind blows from the desert.

 Make your base in Bozeman or one of these awesome Airbnbs in Montana for some western charm and winter tours in Yellowstone with a fantastic Yellowstone itinerary.
  The Powder Highway is the nickname for Canada’s 95A a loop road that covers 630 miles through Southeastern Brittish Columbia. Powderhounds have everything they could want along the highway with small towns, epic ski resorts, untouched backcountry, cat skiing, alpine lodges, and heli-ski operations.
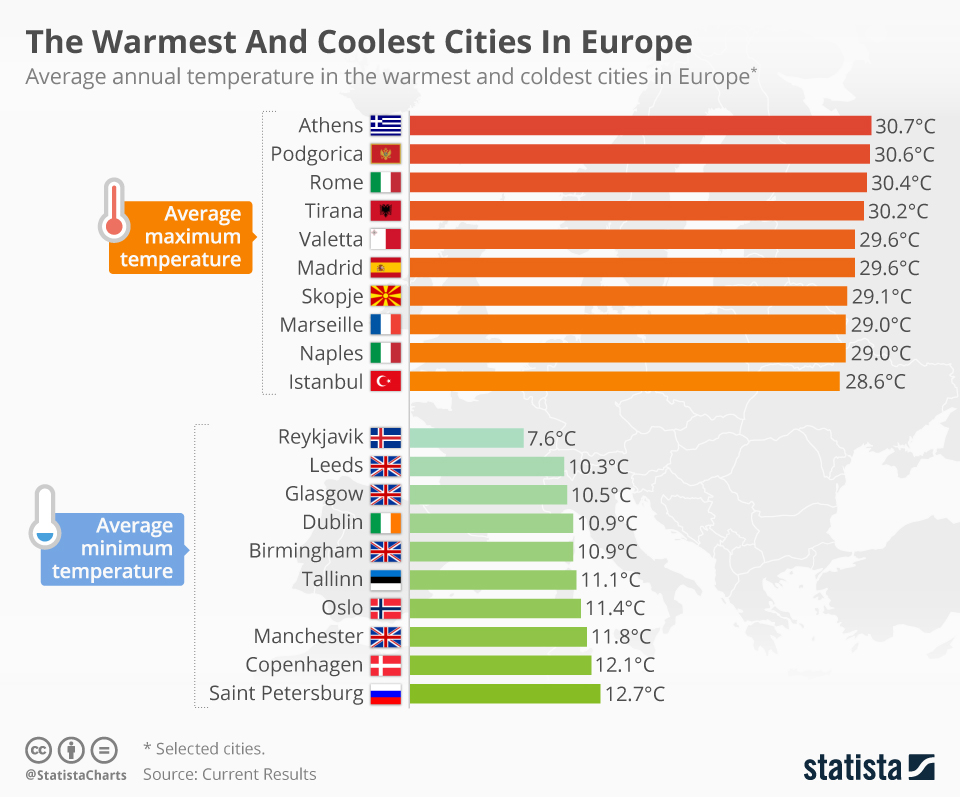
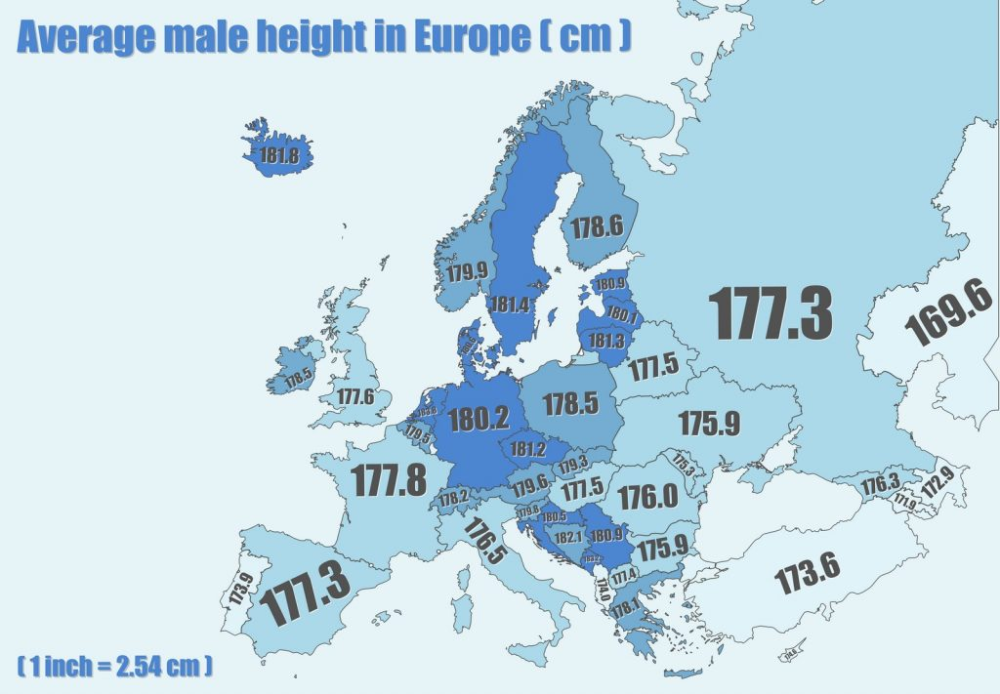 Did I mention the sun shines up to 18 hours a day this time of year? Hello gorgeous sunrises and late sunsets!


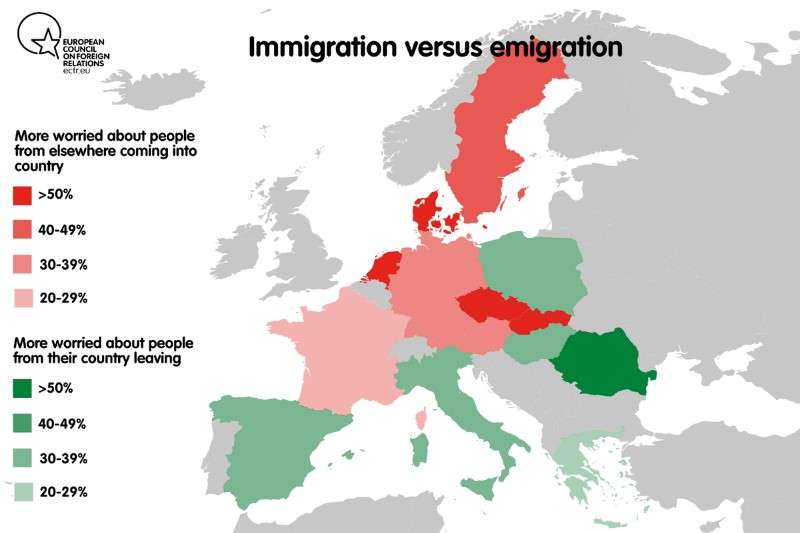
 February may be the high season, but it’s due to the tremendous weather you’re guaranteed. So plan your trip to Hawaii early and book accommodation and rental cars well in advance!
  Also during February? The Venice Carnival, a festival world famous for its elaborate masks!


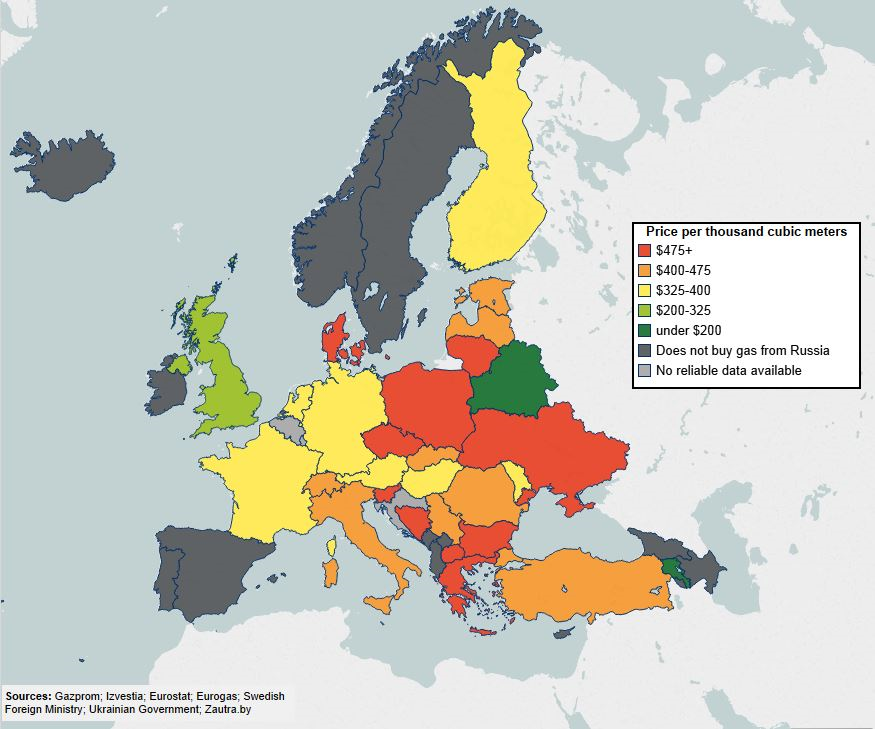
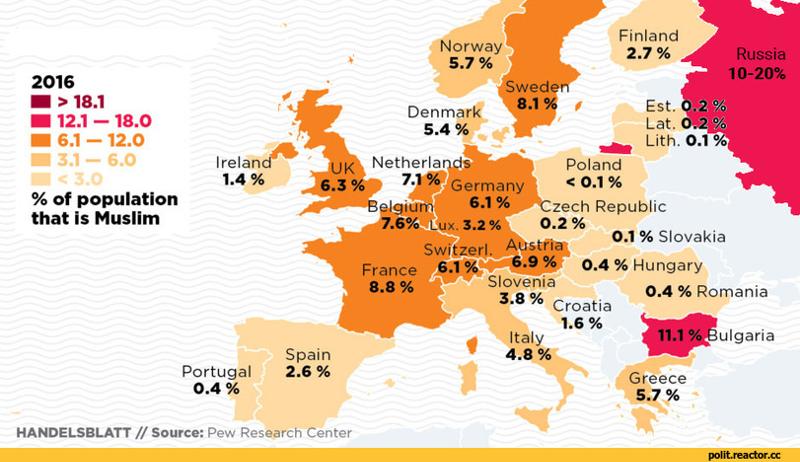 The Christmas rush is over and the rowdy spring breakers haven’t arrived yet so you’ll have the white, sandy beaches and attractions almost all to yourself.
  You never know what can happen while traveling, so it’s best to be prepared. HeyMondo provides excellent short-term and long-term travel insurance plans.
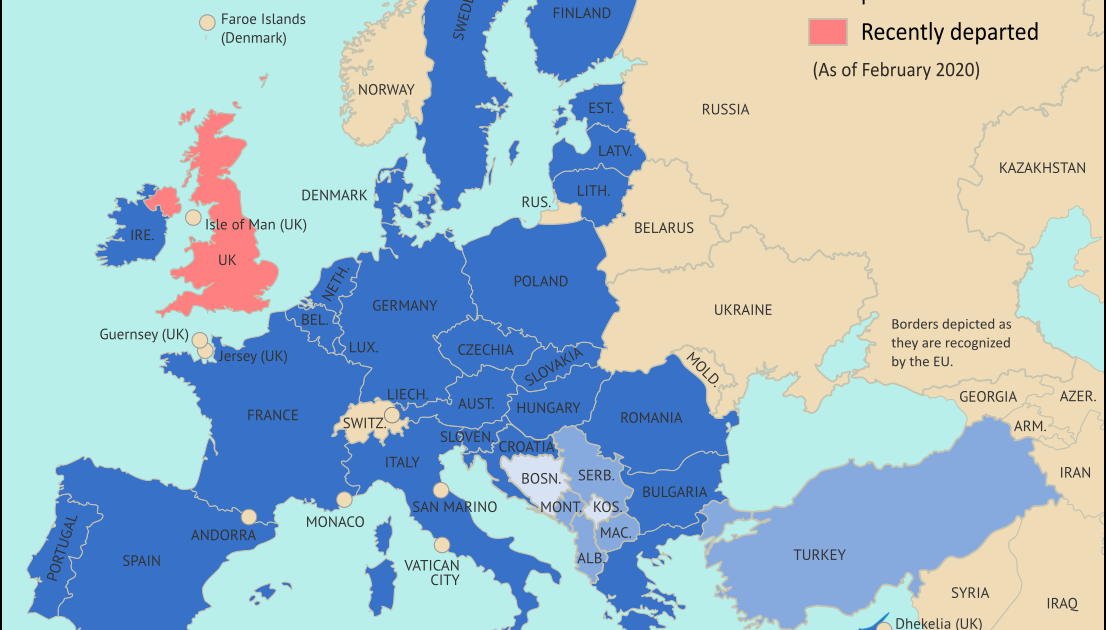 Higher altitudes (think Mount Etna) will be colder yet with its snow-laden sides inviting the skiing crowds to its resorts.
 That said, their runs are uncrowded, and passes are inexpensive, especially in comparison to other popular ski destinations in Italy. Similar to other southern European countries, Sicilians practice the art of siesta year-round: businesses are likely to be closed between 1:30 pm to 4:30 pm, daily.


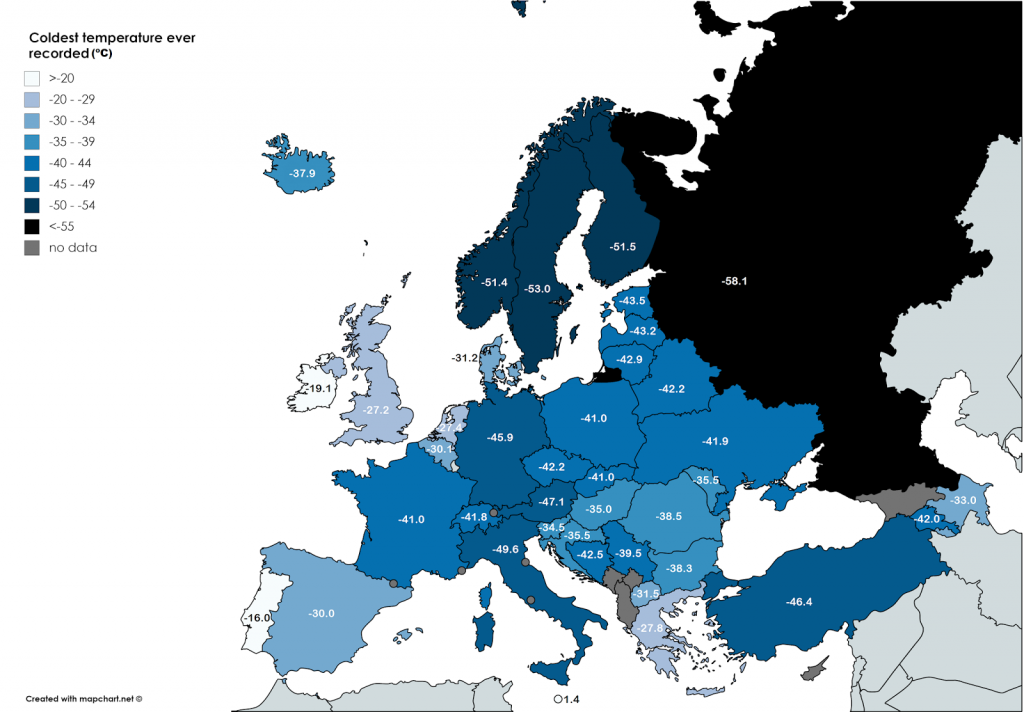 The event is regarded as one of the largest religious processions in the world.
 Biologists and photographers, aren’t you fascinated?
 It is known for its annual carnival: a fifteen-day spectacular of joy with parades, a Carnival Queen, and live music galore. Outside of the carnival, Santa de Cruz is bustling, modern city with all you could need and want to fill your time.
 Or you are looking for an action-packed retirement and are hoping that the grandkids will happily join you over half term. As well as being able to offer kids warm, fun filled days at the beach and in nature parks (hey, you may even be able to tear your child away from their screen with walking up a volcano), there are amusement parks too. There’s Siam Park, a popular water park; Aqualand; Loro Parque, a world-famous animal adventure park; and the Submarine Safari.
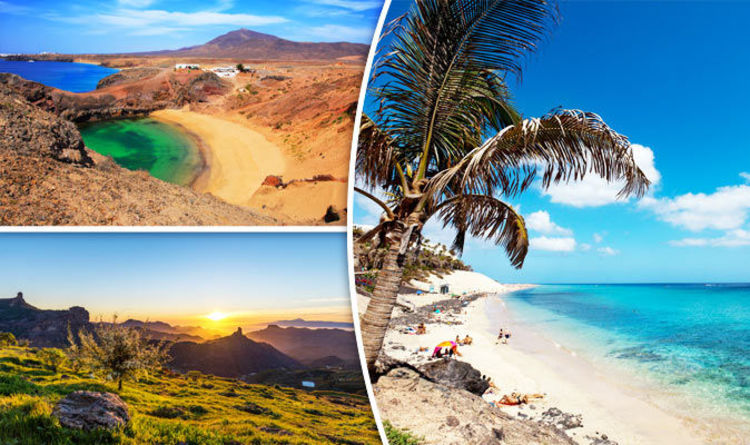 It can be off-putting.
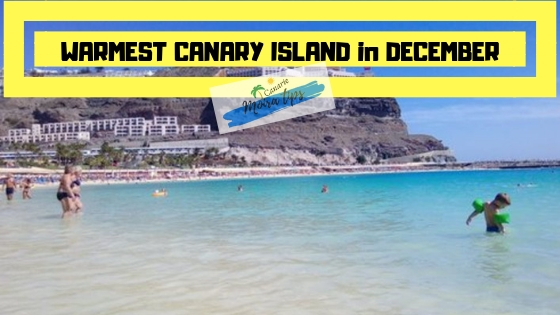 You can rent out during August, the peak holiday season. And then enjoy your property for the other eleven months of the year, in weather that is mostly marginally cooler than the peak season. It is such a great set-up, it sounds like a trick – honestly, it’s not.
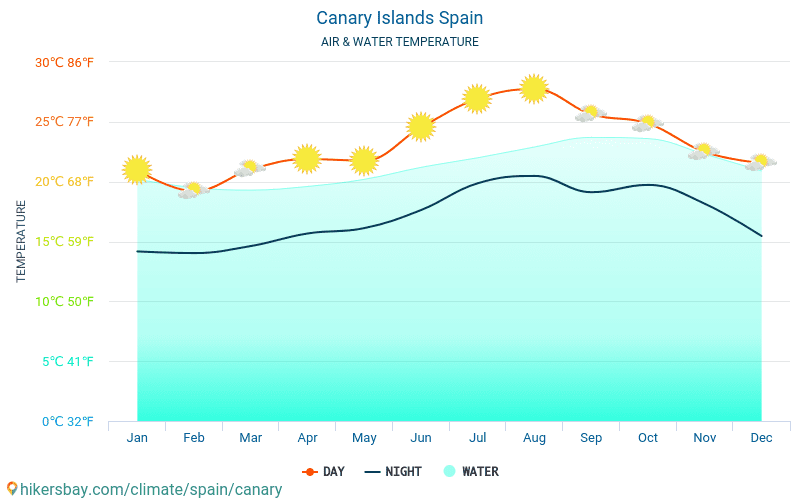 But how much exactly would it cost to call home?
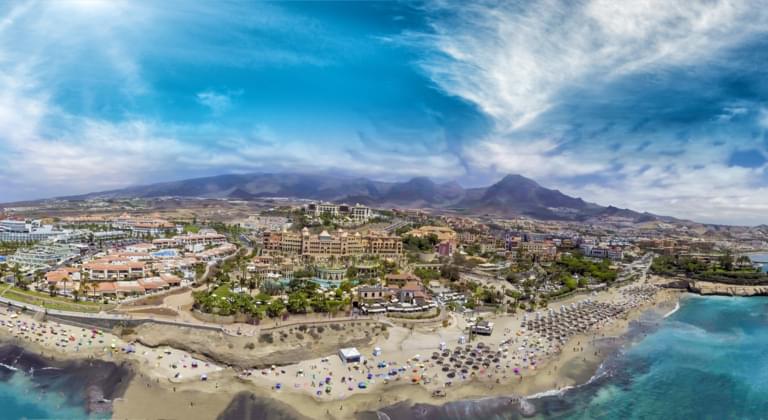 0003 arrival Moon
  The weather forecast for the long term is indicative and is formed on the basis of weather data for similar dates in previous years.
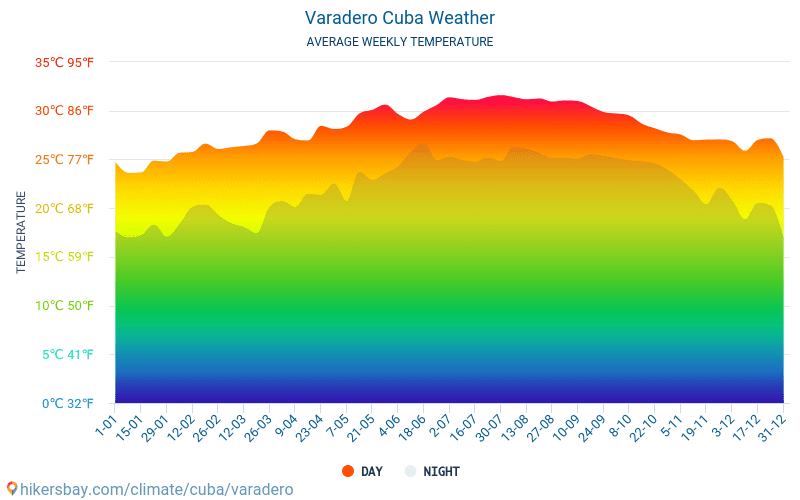 February in Lanzarote is not dissimilar to a warm spring in the UK where you can start to wear summer clothes in the daytime when the sun is out, but you need a cardigan or something warmer to put on for cloudy days or when the sun disappears in the evening.
 February is often the coldest month in the UK with average temperatures of 7 degrees, so stepping off a plane in Lanzarote in 18-20 degree weather feels amazing! Like stepping right into spring or summer!
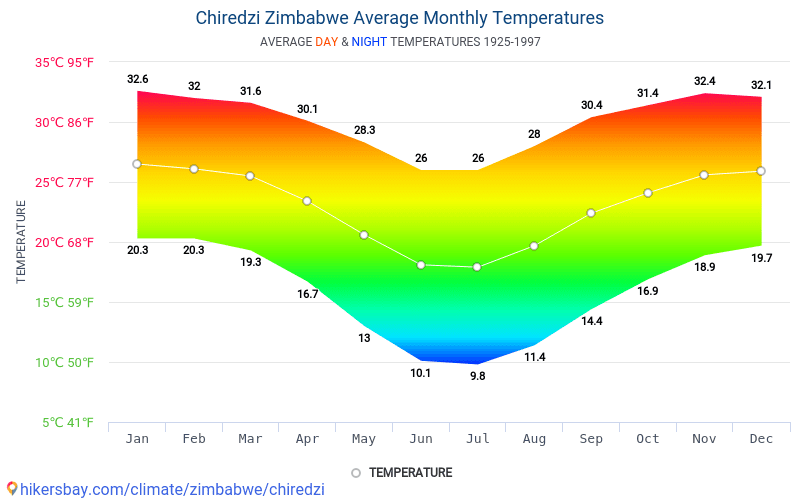 You’re not likely to see a thunderstorm during your trip.
  The dust storms come from the African mainland, and are very unpredictable. It’s a gamble – you may not experience one during your holiday in Lanzarote, but if you do, be prepared to sacrifice a day or two to this weather phenomenon. For the most part, however, February in Lanzarote offers warm weather during the day, chilly nights, and the lottery of nasty dust storms!
 The daytime heat is dry, and the sun intense, so moisturiser and sunblock are essentials.
  Sea water temperature.

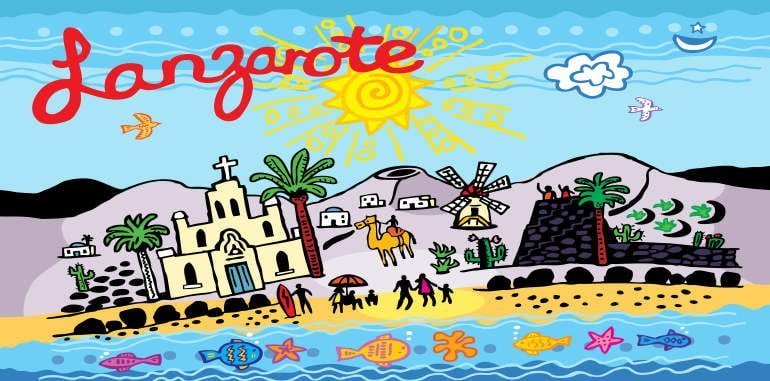 This indicator is affected by both the length of daylight hours and cloud cover. For calculations, we used the daily cloudiness indicators for the last 5 years.
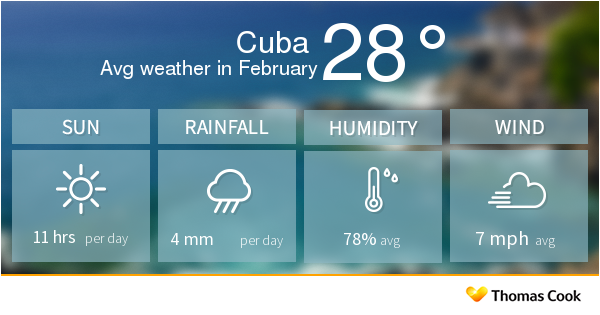 .
. 
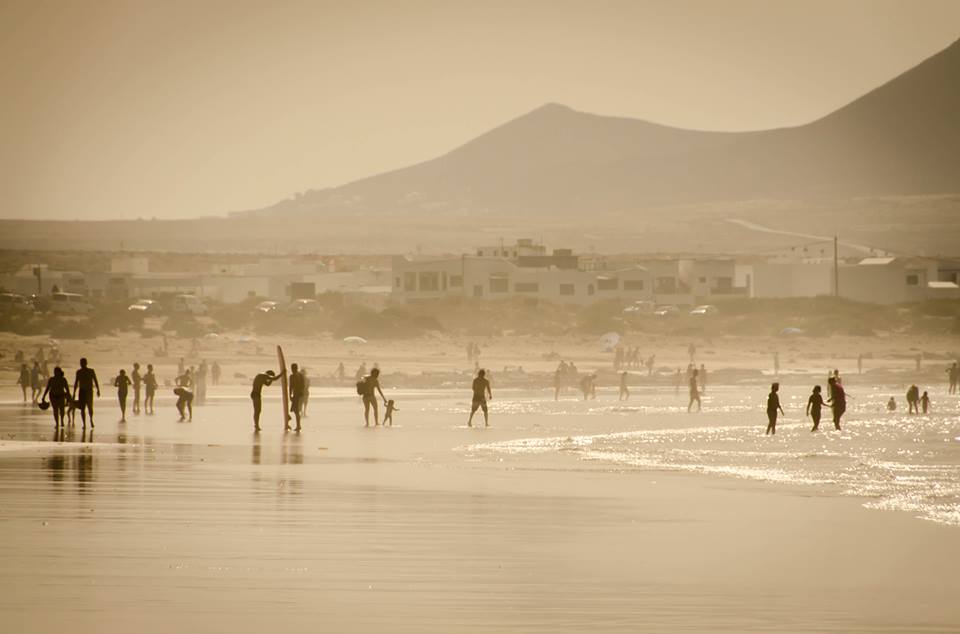
 Temperatures should be around 21C.
 The highest value for February in the afternoon was noted on February 25, 2020 and amounted to +30 °C, the lowest on February 20, 2022: +13 °C.
 The shaded overlays indicate night and civil twilight.

 7 inFeb 11.7 inFeb 281.7 inFeb 281.7 inFeb 111.7 inFeb 111.7 in
 From bottom (most yellow) to top (most gray), the color bands indicate: full daylight, twilight (civil, nautical, and astronomical), and full night.
 The horizontal axis is the day of the year and the vertical axis is the hour of the day. For a given day and hour of that day, the background color indicates the azimuth of the sun at that moment. The black isolines are contours of constant solar elevation.

 The shaded overlays indicate night and civil twilight.
 Lower dew points feel drier and higher dew points feel more humid. Unlike temperature, which typically varies significantly between night and day, dew point tends to change more slowly, so while the temperature may drop at night, a muggy day is typically followed by a muggy night.

 5 mphFeb 2110.5 mphFeb 110.2 mphFeb 110.2 mph

 The black line is the percentage chance that a given day is within the growing season.
 8 kWhFeb 163.8 kWh

 They’re the first trees to flower and are a welcome sight.
 Hotel facilities include an outdoor pool, a restaurant and a café. The guestrooms offer wireless internet access, and balconies with delightful views of the sea or nearby mountains.
 This is a lovely sandy beach fringed by pine trees and is well sheltered from the elements, with artificial reefs on either side of the beach to help keep waves and wind at bay.
 Soak up the laid back atmosphere and eat al fresco on the terrace overlooking the harbour. This restaurant is definitely good value for money, and is the place to beeline to if you fancy a tasty pizza or big plate of pasta.


.jpg) 2
2 4
4 4
4


 4
4


 874 1.874 1.874 1.874 1.874 1.874 1.874 1.LUP
 .. Read more
 32m.
32m.  5°C
5°C 
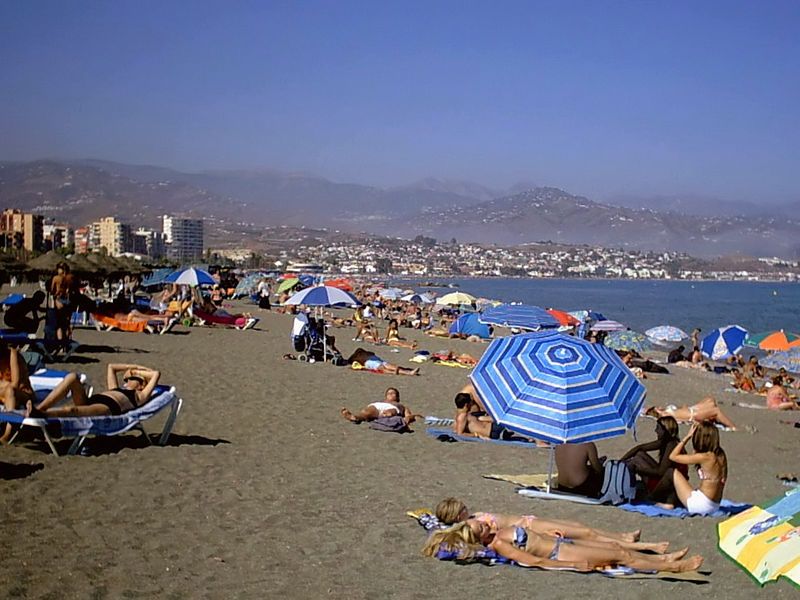

 Shaded areas represent night and civil twilight.
  1 months , ending at about on June 9, .

 5 months from September 29, to May 12, , with more than 11% probability that the given day will be wet. The month with the most rainy days in Malaga-Costa del Sol is December , when on average over 6.4 days there is at least 1 millimeter precipitation.

 There are 9 sightings in Malaga-Costa del Sol0906 Significant seasonal fluctuations in monthly rainfall.
 The thin dotted line is the corresponding mean snowfall.
  MarchApr.MayJulyAug.Sep.Oct.Nov.Dec.0h24h4h20h8h16h12h 12:16:08:20:40:24:00:12:00 8:00 Mar. 20: 12:00 8:00 Mar. 20:14:40 h. 40 min. 21 Jun. 12 h. 9min.23 Sep. 12h 9 min.23 Sep. 9h 39min.21 Dec. 9h 39min.21 Dec.nightnightdayNowNow
  The earliest sunset of is at 18:01 on December 6, , and is the latest on 3 hours 39 minutes later at 21:40 on June 28, .
 Daylight Savings Time (DST) and vice versa are marked with “summer time” labels.
  Sep.Oct.Nov.Dec.004488121216162020002 Jan.2 Jan.18 Jan.18 Jan.1 Feb.1 Feb.16 Feb .16 Feb 2 Mar 2 Mar 18 Mar 18 Mar 1 Apr 1 Apr 16 Apr 16 Apr 30 Apr 30 Apr 16 May 16 May 30 May 30 May 14 Jun 14 Jun 29Jun 29 Jun 13 Jul 13 Jul 28 Jul 28 Jul 12 Aug 12 Aug 27 Aug 27 Aug 10 Sep 10 Sep 25 Sep 25 Sep 9 Oct 9 Oct 25 Oct 25 Oct. 8 Nov. 8 Nov. 23 Nov. 23 Nov. 8 Dec. 8 Dec. 23 Dec. 23 Dec.
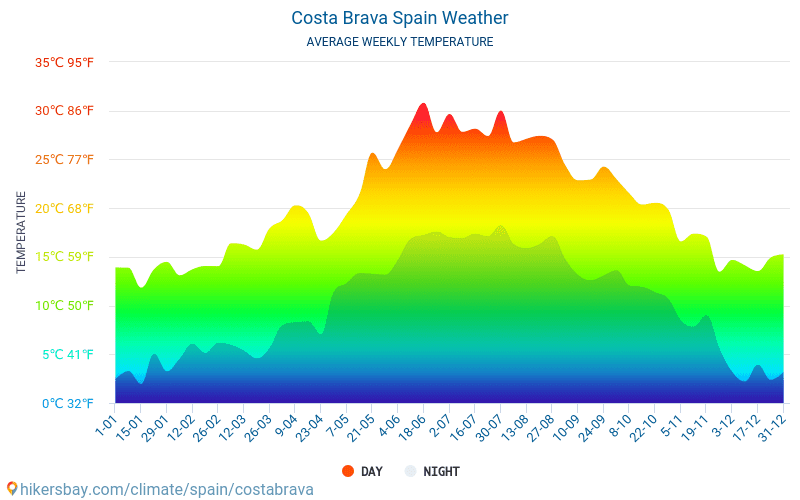

 2 km/h0 percentile.
 5 months , from July 8 to September 23 , with an average temperature above 21 °C . The month of the year in Malaga-Costa del Sol with the warmest water is August , when the average temperature is 23 °C .


 100%2 Aug.100%NowNowNowColdCoolComfortableWarmVery ColdHot
  50 °C19 Jan. 50 °C29 Apr. 500 °C29 Apr. 500 °C 17 Jun. .3,062 °C31 Dec. 3,062 °CNowNow
  1 kWh .


 This information is derived from the NOAA Integrated Hourly Earth Observation System dataset based on ICAO METARs as required.
 This reanalysis combines various measurements over a wide area in a modern global meteorological model to reconstruct hourly weather history around the world on a 50 km grid.
